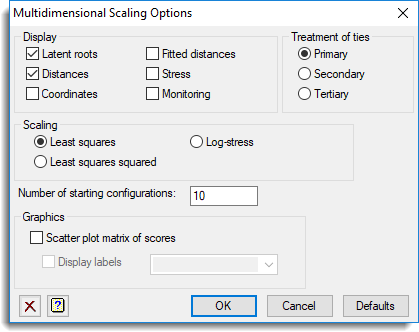
This dialog controls aspects of the way in which the multidimensional scaling analysis is calculated, and selects the information to be output.
Display
This specifies which items of output are to be produced by the analysis.
| Latent roots | Latent roots of the solution coordinates |
| Distances | Inter-unit distances, computed from the solution configuration |
| Coordinates | Solution coordinates, rotated to principal coordinates |
| Fitted distances | Fitted values from the regression of the inter-unit distances on the distances in the data matrix |
| Stress | Stress of the solution coordinates |
| Monitoring | Outputs a summary of the results at each iteration. |
Scaling
Selects the stress function to be minimized: Least squares, Least squares squared or Log-stress.
Treatment of ties
Specifies the way in which ties, or equal values, in the data matrix are to be treated. With Primary treatment of ties, no restrictions are placed on the distances corresponding to tied distances in the data matrix. In the Secondary treatment of ties, the distances corresponding to tied values are required to be as nearly equal as possible. Tertiary treatment of ties is a compromise between the primary and secondary approaches to ties: the block of ties corresponding to the smallest distance are handled by the secondary treatment, the remaining blocks of ties are handled by the primary treatment. This is particularly useful when the distances take only a few values.
Number of starting configurations
Specifies the number of starting configurations to use. Since the multidimensional algorithm is an iterative one, making use of the method of steepest descent, there is no guarantee that the solution coordinates found from any given starting configuration has the minimum stress of all possible configurations. The algorithm may have found a local, rather than the global, minimum. This problem may be partially overcome by using a series of different starting configurations. If several of the solutions arrive at the same lowest stress solution, then you may be reasonably confident of having found the global minimum.
Graphics
Specifies graphical display of the results from the analysis.
| Scatter plot matrix of scores | Draws a scatter plot matrix of the scores. The number of dimensions displayed in the plot will be equal to that specified on the main menu. |
| Display labels | Specify a text containing labels for the individual points displayed in the plots. The text should be equal in length to the data variates. |