Use this to control various options relating to the display of pie charts.
- To alter the settings for a pie chart, double-click your graph then click the Pie Chart Options tab.
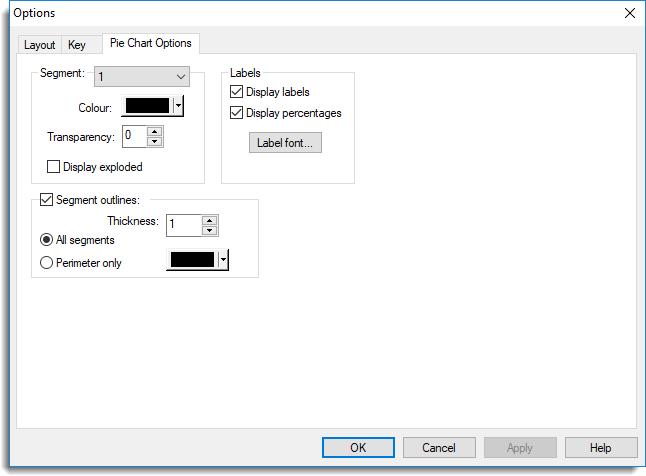
Segment
Selects which segment of the pie chart you want to modify.
Colour
Sets the colour of the currently selected segment.
Transparency
Sets the transparency of the currently selected segment. You can use the up and down arrows to cycle through integer values in the range 0 (opaque) to 255 (completely transparent).
Display exploded
This option requests that the segment is offset from the centre of the pie chart, in order to highlight the data it represents.
Segment outlines
Controls the display and colour of segment outlines.
Display labels
Displays segment labels
Label font
Change attributes of the font used for the labels.
Display percentages
Displays the percentage of the total represented by each segment.