Use this to specify options for linkage disequilibrium (LD) decay analysis.
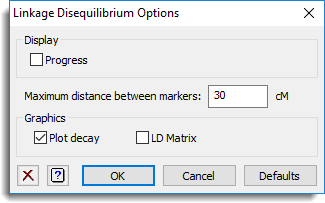
Display
This specifies which items of output are to be produced by the analysis.
| Progress | Produces monitoring output detailing the progress of the analysis |
Maximum distance between markers
Provides a space to specify the maximum distance to use between markers for LD to be calculated.
Graphics
This specifies whether plots are to be produced by the analysis.
| Plot decay | Plots the probability values for the deviance ratios, on a -log10 scale, against the marker distance. |
| LD matrix | Produces a shade plot of the LD matrix. |
Action buttons
| OK | Stores the option settings and closes the dialog. |
| Cancel | Close the dialog without making any changes. |
| Defaults | Sets the options to their default settings. |
Action Icons
| Clear | Clear all fields and list boxes. | |
| Help | Open the Help topic for this dialog. |
See also
- Linkage disequilibrium (LD) decay menu.
- QLDDECAY procedure in command mode