Select menu: Stats | QTLs (linkage/Association) | QTL Analysis | Single Trait Association Analysis (Multiple Environments)
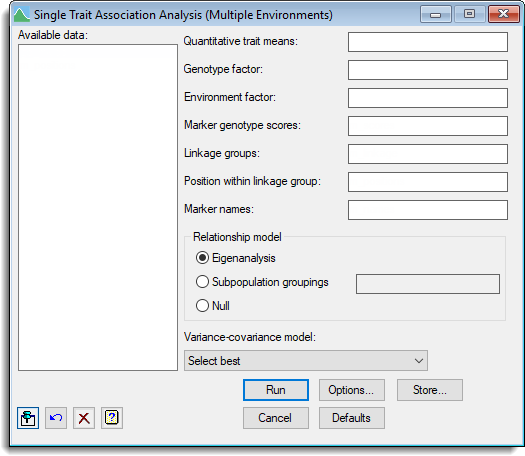
Use this to perform a mixed model marker trait association analysis (also known as linkage disequilibrium mapping) in multi-environment trials. When testing for marker trait association in a genetically diverse population, it is necessary to account for population structure, which introduces non independence between genotypes as a result of common genetic background.
- After you have imported your data, from the menu select
Stats | QTLs (linkage/Association) | QTL Analysis | Single Trait Association Analysis (Multiple Environments). - Fill in the fields as required then click Run.
You can set additional Options before running the analysis and store the results by clicking Store.
Available data
This lists data structures appropriate to the current input field. Double-click a name to copy it to the current input field or type the name. If data has been stored in a QTL data space then only the data structures present within that data space will be displayed in the Available data, otherwise all the current data within Genstat will be displayed. When data are present within the QTL data space you can right-click on the Available data list to open a shortcut menu where you can change between displaying data only within the data space and all data within Genstat.
Quantitative trait means
A variate specifying the quantitative trait (phenotypic) means for each genotype.
Genotype factor
A factor specifying the genotype for each mean.
Environment factor
A factor specifying the environment for each mean.
Marker genotype scores
A pointer specifying the marker scores. The pointer should contain a set of factors (one for each marker) where each factor contains the labels for the alleles separated by the ‘/’ character.
Linkage groups
A factor defining the different linkage groups (or chromosomes).
Position within linkage group
A variate specifying the positions within linkage group for each marker.
Marker names
A text specifying the names for each marker.
Relationship model
Specifies the model to account for genetic relatedness between genotypes.
| Eigenanalysis | Infers the underlying genetic substructure in the population by retaining the most significant principal components from the molecular marker matrix – the scores of the significant axes are used as covariables in the mixed model, which effectively is an approximation to the structuring of the genetic variance covariance matrix by a coefficient of coancestry matrix (kinship matrix). |
| Subpopulation groupings | Provides a space to supply a factor of subpopulation groupings to be included in the mixed model. |
| Null | No correction is made for genetic relatedness. |
Variance-covariance model
This lets you select the variance-covariance model to use across the set of environments.
Action buttons
| Run | Run the association analysis. |
| Cancel | Close the dialog without further changes. |
| Options | Opens a dialog where additional options and settings can be specified for the analysis. |
| Defaults | Reset options to the default settings. Clicking the right mouse on this button produces a pop-up menu where you can choose to set the menu using the currently stored defaults or the Genstat default settings. |
| Store | Opens a dialog to specify names of structures to store the results from the analysis. |
Action Icons
| Pin | Controls whether to keep the dialog open when you click Run. When the pin is down |
|
| Restore | Restore names into edit fields and default settings. | |
| Clear | Clear all fields and list boxes. | |
| Help | Open the Help topic for this dialog. |
See also
- Options for choosing settings for the analysis and which results to display
- Store options for choosing which results to save
- Single trait association analysis (single environment) menu.
- QTL data space for using data in QTL menus
- QTL analysis using menus
- QMASSOCIATION procedure in command mode