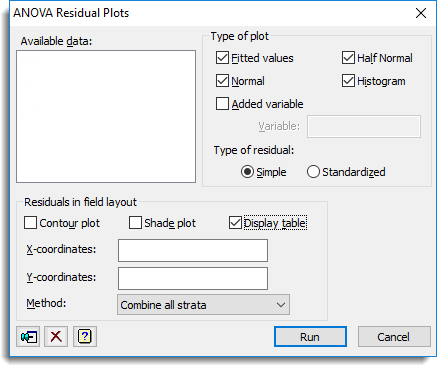
- To generate residual plots following an analysis of variance, click Further Output then click Residual Plots.
Available data
This lists variates that can be used for the added variable or coordinates for locations. Double-click a variate name to copy it to the Variable field or type the name.
Type of plot
| Fitted values | Residuals versus fitted values |
| Normal | Normal plot |
| Added variable | Added variable plot |
| Half Normal | Half Normal plot |
| Histogram | Histogram of residuals |
A maximum of four plots can be produced at one go.
Variable
Specifies the variate or factor that is to provide x-values for the added variable plot. This could, for example, be residuals from an analysis of variance of a possible covariate.
Type of residual
Controls the type of residuals that are used in the plots. You can choose either Simple or Standardized residuals.
Residuals in field layout
In a field experiment it can be useful to study the spatial pattern of the residuals, for example to see if there are any systematic trends in fertility. These options let you plot the residuals in field layout.
Contour plot
Select this to draw a contour plot of the residuals if the plots are on a regular grid.
Shade plot
Select this to draw a shade plot of the residuals if the plots are on a regular grid.
Display table
Displays the residuals in a table whose structure corresponds to the field layout.
X-coordinates
A variate specifying the X-coordinates for the locations of the plots.
Y-coordinates
A variate specifying the Y-coordinates for the locations of the plots.
Method
This lists the different type of residuals that can be used. Select Combine all strata to combine the residuals from all the strata (or error terms) in the analysis, or Final stratum only to use the residuals only from the final stratum.