Use this to select different options to be used in a Response Surface for the quadratic model.
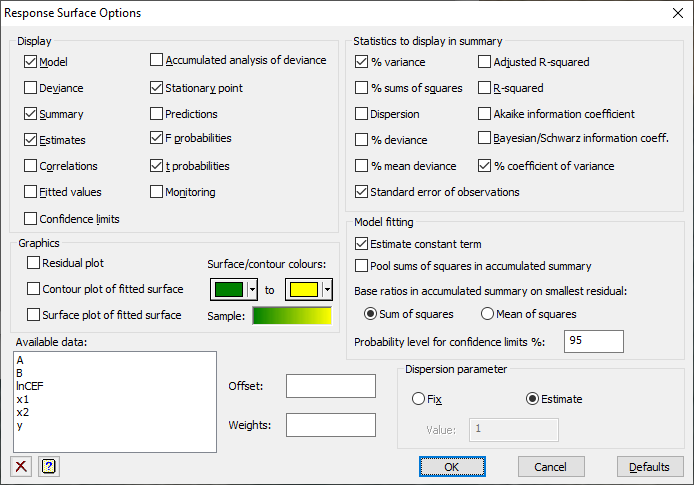
Display
Specifies which items of output are to be displayed in the Output window.
| Model | A description of the model, including response and explanatory variates |
| Deviance | The deviance of the fitted model |
| Summary | A summary analysis of variance, or analysis of deviance in generalized linear models |
| Estimates | The estimates of parameters in the model |
| Correlations | Correlations between the parameter estimates |
| Fitted values | A table containing the values of the response variate, the fitted values, standardized residuals and leverages |
| Accumulated analysis of deviance | Analysis of variance/deviance table containing a line for each term in the fitted model |
| Confidence limits | Confidence intervals for the parameters. The confidence limit can specified as a percentage using the Probability level for confidence limits (%) field |
| Stationary point | The height and position of the stationary point with standard errors |
| Predictions | The predictions from the fitted surface at the specified X-1 and X-2 prediction levels |
| F probabilities | F probabilities for variance ratios |
| t probabilities | t probabilities for the parameter estimates |
| Monitoring | Monitoring information from the estimation when using a GLM |
Statistics to display in data summary
This gives a range of statistics giving describing the overall fit of the model. Details of these can be found in the under the SELECTION option of FIT directive.
Graphics
This controls what graphical plots are displayed from the analysis:
| Residual plots | Plots residuals from the analysis using the RCHECK procedure |
| Surface plot of fitted surface | Uses the DSURFACE directive to produce a surface plot of the fitted model |
| Contour plot of fitted surface | Uses the DCONTOUR directive to produce a contour plot of the fitted model |
| Surface/contours colours | This allows you to select the colours used for the low to high values in the surface and contour plots. Click the colour buttons to change the colours for the low and high values. The Sample field shows the colour range that will be used in the graph |
Model fitting
| Estimate constant term | Specifies whether to include a constant in the model. This omits the intercept; in other words the fitted surface is constrained to pass through the origin |
| Pool sums of squares in accumulated summary | Whether to pool sums of squares in accumulated summary between all terms fitted in a linear model (ticked = yes) |
| Base ratios in accumulated summary on smallest residual | Whether to base ratios in accumulated summary on root mean square from model with smallest residual sum of squares or smallest residual mean of squares |
| Probability level for confidence limits (%) | This gives the probability (as a percentage) that the confidence interval covers the true value. This should be a value between 0 and 100 and if it is too close to 100 then it will not be well estimated unless the number of bootstraps is large |
Available data
This lists data structures appropriate to the current input field (either Offset or Weights). Double-click a name to copy it to the current input field or type the name.
Offset
A generalized linear model can be modified to take account of a fixed contribution to the linear effects for each unit, supplied in a variate referred to as the offset.
Weights
A variate of weights can be supplied to give varying influence of each unit on the fit of the model. This would usually correspond to a known pattern of variance of the observations, when the weights would be the reciprocal of the variances.
Dispersion parameter
Controls whether the dispersion parameter for the variance of the response is estimated from the residual mean square of the fitted model, or fixed at a given value. The dispersion parameter (fixed or estimated) is used when calculating standard errors and standardized residuals. In models with the binomial, Poisson, negative binomial, geometric and exponential distributions, the dispersion should be fixed at 1 unless a heterogeneity parameter is to be estimated.
See also
- Response Surface menu
- Response Surface Spline Options
- Response Surface Quadratic Store Options
- Response Surface Spline Store Options
- RQUADRATIC procedure in command mode