Use this to save results from a Response Surface in Genstat data structures when the Spline model is being used. After selecting the appropriate boxes, type the names for the identifiers of the data structures into the corresponding In: fields.
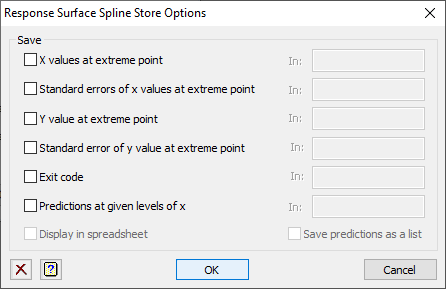
Save
| X values at extreme point | Variate | The x-values at the extreme point for the spline model |
| Standard errors of x values at extreme point | Variate | The standard errors of the x-values at the extreme point for the spline model |
| Y value at extreme point | Scalar | The estimated y-value at the extreme point for the spline model |
| Standard error of y value at extreme point | Scalar | The standard error of the y-value at the extreme point for the spline model |
| Exit code | Scalar | The exit code from the VSURFACE procedure. If this is zero the model fitting and any bootstrapping have been successful |
| Predictions at given levels of x | Matrix | The estimated y-values at the prediction levels for the x-values |
Display in spreadsheet
Select this to display the results in a new spreadsheet windows.
Save predictions in a list
When saving Predictions at given levels of x, if this is selected the predictions will be saved in 3 columns giving the X1 and X2 prediction levels and then the estimated y values. The predicted values at the observed data points are also included in the first rows, followed by the prediction levels on the grid of x-levels. If this is not selected, the predictions will be returned in a matrix with the columns being giving the X2 levels and rows the X1 levels.