
You can restrict the rows of a spreadsheet using a selection of points from an associated graph. The selected points can be used to include or exclude the spreadsheet rows. If the rows are being excluded and the sheet already has some excluded rows, the selected points can be added to the exclusion.
For our example we’ll create a simple 2D scatter plot and select our data points from this. First, you’ll select data points, then copy this information to the clipboard, and finally apply the restriction to your spreadsheet to hide the required rows.
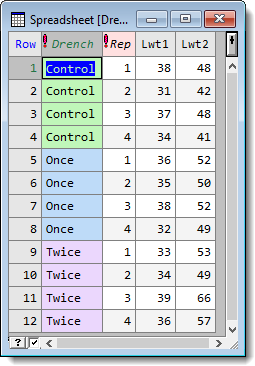
- With your spreadsheet open, from the menu select Graphics | 2D Scatter Plot.
- Fill out the dialog as shown below then click Run.
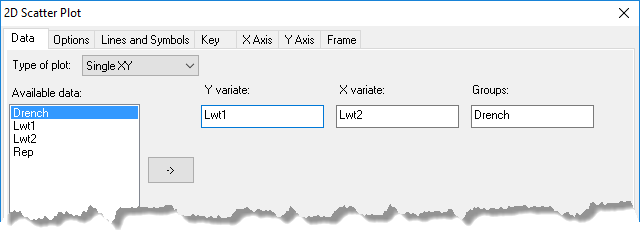
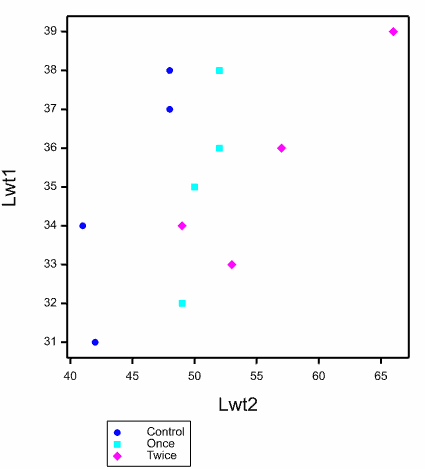
Your graph may look different from that shown below depending on your Graph Options settings.
- From the Graphics viewer menu select Tools | Data Information Mode.
The cursor now displays as a question mark. - Select the Control points on the graph by clicking them with the mouse (refer to the legend below the graph to see which points are labelled Control).
- To copy the data points to the clipboard select Edit | Copy Data Information.
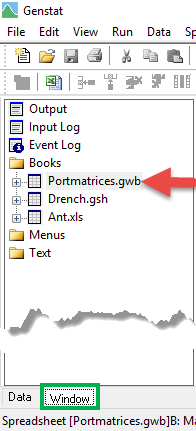
- Now re-display your spreadsheet: click the Window tab at the bottom left of the screen.
- Double-click your spreadsheet to re-display it. This enables the options on the Spread menus.
- Select Spread | Restrict/Filter | Rows selected from Graph.
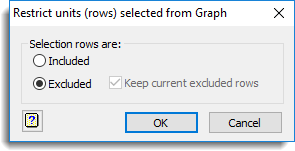
- Select Excluded then click OK.
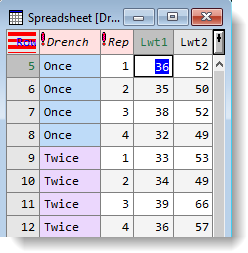
The resulting spreadsheet now displays without the Control rows.
Keep current excluded rows
If the sheet is already restricted and you tick this option, the selected points from the graph will be added to the excluded rows. If this is not ticked, then only the rows associated with the selected points will be excluded, so that the previously excluded rows will be added back into the included set. This option is only enabled when the spreadsheet is already restricted.