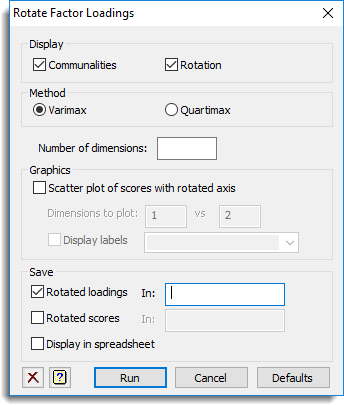
This dialog lets you rotate factor loadings from a principal components analysis according to either the Varimax or Quartimax criterion. Principal components analysis defines a set of dimensions (sometimes called axes) that are linear combinations of the original variables. The individual coefficients of these combinations are called loadings, and can be used to interpret the dimensions.

With principal components analysis, the loadings must lie in the range [-1, +1]. When several dimensions are considered it is possible to define an equivalent set of new dimensions, whose loadings are linear combinations of the original loadings. If the absolute values of the loadings for a new dimension are either close to 0 or close to 1, you can interpret the dimension as mainly representing only those original variables with large positive (or negative) loadings. You may sometimes want new dimensions determined by loadings like these, because they are easier to interpret. The methods by which these new dimensions can be obtained are generally known collectively as factor rotation because the new dimensions represent a rotation of the axes of the original dimensions.
Display
This specifies which items of output are to be produced by the analysis.
| Communalities | Displays the communalities of the variables |
| Rotation | Displays the rotated factors |
Method
Controls the method used for the factor rotation. The Varimax rotation, maximizes the variance of the squares of the loadings within each new dimension: the effect of this rotation should be to spread out the squared-loadings to the extremes of their range. The Quartimax rotation uses the fourth power of the loadings instead of the second power.
Number of dimensions
This specifies the number of dimensions to rotate from the original loadings (the other dimensions are left unchanged).
Graphics
Specifies graphical display of the results from the analysis.
| Scatter plot of scores with rotated axis | Draws a scatter plot matrix of the principal component scores with the rotated axis. The axis dimensions to be displayed in the plot can be specified using the Dimensions to plot option |
| Dimensions to plot | Controls the axis dimensions to be used in the plot. The axis dimension should be less than or equal to the number specified in the Number of dimensions field in the principal components options |
| Display labels | Specify a text containing labels for the individual points displayed in the plots. The text should be equal in length to the data variates |
Save
This lets you save results from the factor rotation in Genstat data structures. After selecting the appropriate boxes, you need to type the names for the identifiers of the data structures into the corresponding In: fields.
| Rotated loadings | Matrix | Of the rotated loadings |
| Rotated scores | Matrix | Of the rotated scores |
Display in spreadsheet
Select this to display the results in a new spreadsheet window.
See also
- FACROTATE directive