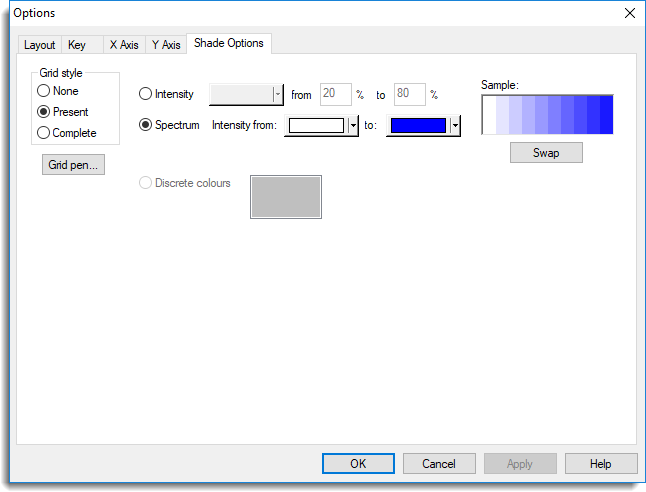
This menu controls various options relating to the display of shade plots.
- To alter the settings for a shade plot, double-click your graph then click the Shade Options tab.

Grid style
Controls whether a grid is superimposed on the plot. For plots containing missing values you can choose whether to include or exclude grid lines around empty cells.
Grid pen
Lets you modify attributes of the grid lines.
Colours
Controls how the cells in the shade plot are coloured. The value in each cell is mapped onto a colour scale of the type specified.
An Intensity colour scale consists of a single base hue or tint displayed with increasing lightness as the Z-value increases. It is equivalent to a colour spectrum with different intensities of the same base colour. You can change the intensities to be displayed using decreasing lightness by clicking the Swap button.
A Spectrum consists of a continuous progression from one colour to another. You can change the order of the colours by clicking Swap.
A Discrete colour scale uses a different colour for each distinct value in the data set. Its use is most appropriate for display of discrete information, such as treatment levels, on a geographic grid.