Select menu: Graphics | Shade Plot
Use this to specify data for a shaded representation of a rectangular or symmetric matrix (shade plot). Each element of the data matrix is represented by a shaded rectangle indicating the value at that location, using either colour or shading density. This type of display is often used for graphical display of spatial data or in a cluster analysis to display a similarity matrix.
- After you have imported your data, from the menu select
Graphics | Shade Plot. - Fill in the fields as required then click Run.
You can set additional options and axis settings by clicking the Options, X axis, Y axis and Frame tabs.
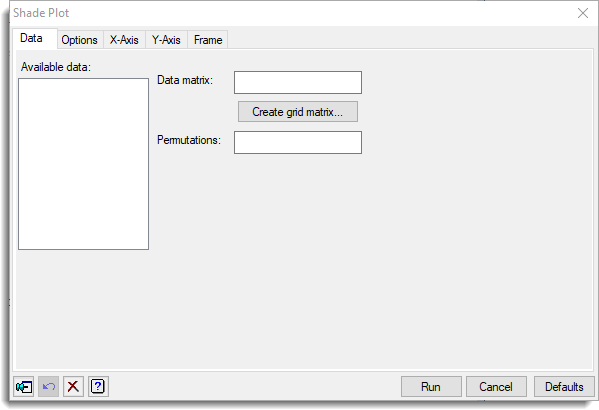
Available data
This lists data structures appropriate to the current input field. It lists either matrices or symmetric matrices for specifying the data. The contents will change as you move from one field to the next. Double-click a name to copy it to the current input field or type the name.
Data matrix
Specifies a matrix or symmetric matrix containing the values that are to be displayed. Double-click the name of the identifier for the data within the Available data list to copy it across or type the name.
Create matrix
This opens a menu where you can create a matrix of values.
Permutations
Specifies a variate containing a permutation of the units for a similarity matrix. Double-click the name of the identifier for the data within the Available data list to copy it across or type the name.
Action buttons
| Run | Produce the graph. |
| Cancel | Close the dialog without further changes. |
| Defaults | Reset options to their default settings. |
Action Icons
| Pin | Controls whether to keep the dialog open when you click Run. When the pin is down |
|
| Restore | Restore names into edit fields and default settings. | |
| Clear | Clear all fields and list boxes. | |
| Help | Open the Help topic for this dialog. |
See also
- Shade plot options tab menu.
- Axis and Frame options.
- Contour plot menu
- Surface plot menu
- 3D histogram menu
- DSHADE directive in command mode