Select menu: Stats | Sample Size | Lin’s Concordance Coefficient
Use this to calculate the number of replicates (sample size) or the power required for Lin’s Concordance Coefficient. Lin’s concordance correlation coefficient can be used to assess how well a new method of measurement reproduces the results provided by a standard method. To do this, you measure the same set of units using the two methods, and calculate the concordance between the resulting two sets of measurements. The methods are regarded as equivalent if the coefficient is greater than some threshold.
- From the menu select
Stats | Sample Size | Lin’s Concordance. - Fill in the fields as required then click Run.
After running the calculation you can save the results by clicking Save.
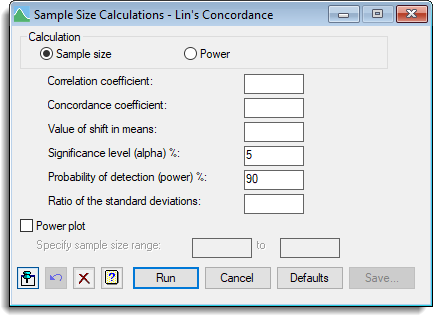
Calculation
Specifies the calculation to be carried out: Sample size, or Power.
Correlation coefficient
Specifies the correlation for two samples with the smallest amount of non-reproducibility required to be detected.
Concordance coefficient
Specifies the value of Lin’s concordance for two samples with the smallest amount of non-reproducibility required to be detected.
Value of shift in means
Specifies the value of the shift in means (divided by the harmonic mean of the standard deviations) for two samples with the smallest amount of non-reproducibility required to be detected.
Significance level (alpha)%
Specifies the significance level at which the response is to be tested.
Probability of detection (power)%
For a sample size calculation this specifies the required probability for detection of the response (that is, the power of the test).
Sample size
For a power calculation this specifies the sample size to be used to calculate the probability of detection (power).
Ratio of the standard deviations
Specifies the value of the ratio of the standard deviations for two samples with the smallest amount of non-reproducibility required to be detected.
Power plot
When selected, produces a plot of power versus sample size. When Sample size is selected the plot is generated using 11 replication values centred around the required number of replicates for the requested power. When Power is selected you can specify a range of sample size values for the plot in the spaces provided.
Action Icons
| Pin | Controls whether to keep the dialog open when you click Run. When the pin is down |
|
| Restore | Restore names into edit fields and default settings. | |
| Clear | Clear all fields and list boxes. | |
| Help | Open the Help topic for this dialog. |
See also
- Sample Size Save Options to store the results
- SLCONCORDANCE procedure