Stacking lets you place several columns on top of each other to form a single column of values. Stacking can be useful when you have gathered repeated measurements from an experiment: you can put all the measurements into a single variate by stacking them, create a corresponding factor column to categorize and identify each group of measurements, then perform a combined analysis on the whole set.
Unstacking lets you separate grouped data into multiple columns based on the levels of an unstacking factor.
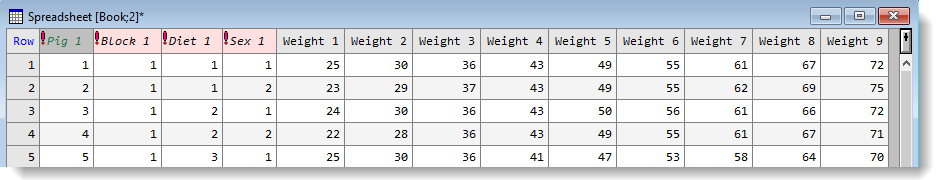
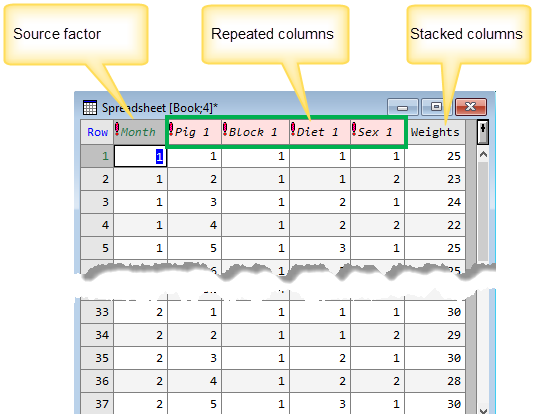
The spreadsheet below show the results of a study into the effects of sex and diet on the growth of pigs over time. In the following example we’ll stack the Weight columns together into a new column called Weights and create a factor column Month so that we can identify each set of observations.
- From the menu select Spread | Manipulate | Stack.
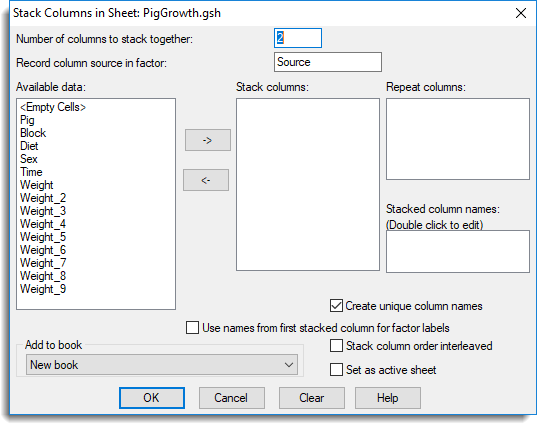
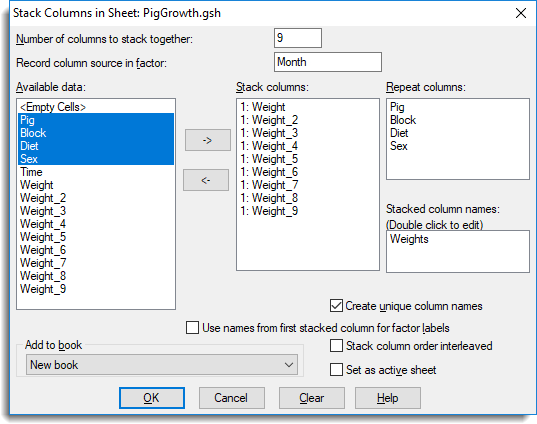
- Set the Number of columns to stack together.This tells Genstat how many columns you want to stack together at a time. In our example we want to stack all 9 weight columns into one column, so we’ll enter ‘9’.
- Type a factor name in Record column source in factor. This creates a new column containing a factor where each level will represent a column that has been stacked. In our example the weight measurements were taken over a number of months, so we’ll type ‘Month‘ as our factor.
- Move items from Available data into Stack columns by double-clicking them. You can select multiple items by holding down Ctrl while clicking with the mouse, then click
 to move them all across in one action.In our example, Genstat prefixes the names in Stack columns with a ‘1’. The ‘1’ indicates the columns we want to stack together in our stacked column.
|
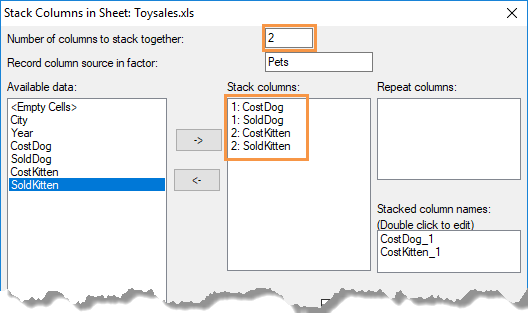
Using a different example for a moment, if you want to create two stacked columns, type ‘2’ in Number of columns to stack together. When adding columns to the Stack columns list, the first two columns will be prefixed by the number ‘1’ to indicate that they will be placed into the first stacked column. The second two columns will be prefixed by the number ‘2’, to indicate that they will be placed into the second stacked column.
|
- If you want to include repeated columns, move items from Available data into Repeat columns by double-clicking them. You can select multiple items by holding down Ctrl while clicking with the mouse, then click to move them all across in one action.
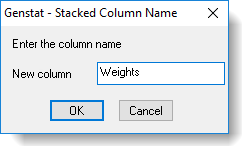
- To change the default name that Genstat will assign to your stacked column, double-click the name in Stacked column names, type a new name then click OK.
- Set options as required (see Stacking options below) then click OK.
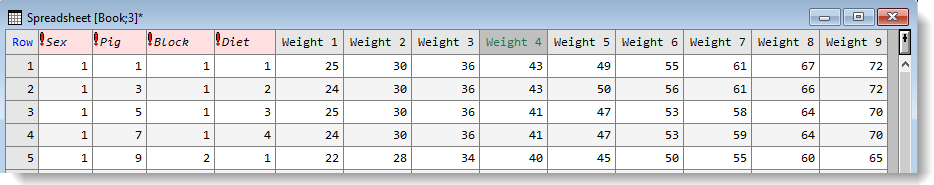
The spreadsheet opens to display your data. The first column contains your source factor while the final column contains your stacked data.
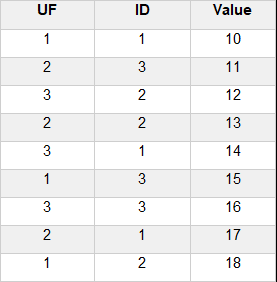
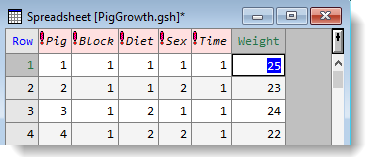
The spreadsheet below show the results of a study into the effects of sex and diet on the growth of pigs over time. The Weight column contains nearly 300 observations taken during 9 time periods. In the following example we’ll unstack the Weight column using the factor levels in the Time column to identify each group. The end result will be 9 individual Weight columns.
- From the menu select Spread | Manipulate | unstack.
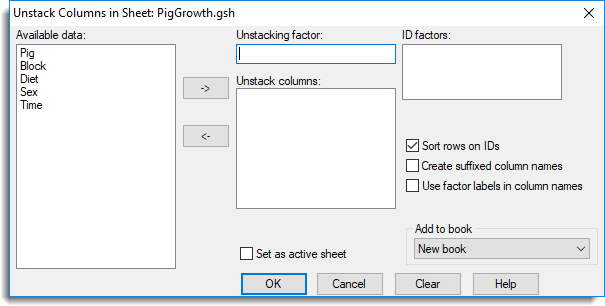
- In the Available data field, double-click a column to move it to the Unstacking factor field.
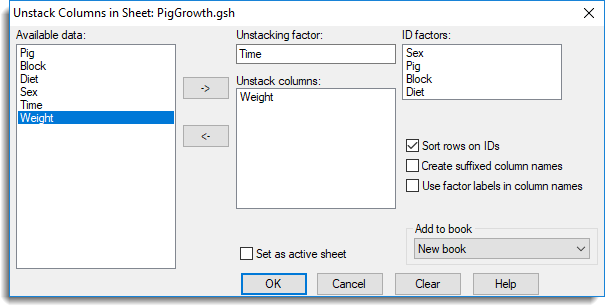
- If you want to specify one or more ID Factors, move items from Available data into ID factors by double-clicking them. You can select multiple items by holding down Ctrl while clicking with the mouse, then click to move them all across in one action.
- Repeat the instruction above to select and move columns to the Unstack columns field.
- Set options as required (see Unstacking options below) then click OK.
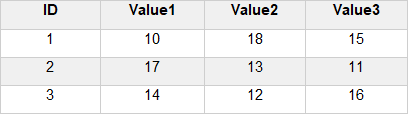
The spreadsheet opens to display your unstacked columns.