Select menu: Stats | Sample Size | t-tests
Use this to calculate the number of replicates (sample size) or the power required for various types of t-test. The calculations can be done for a one-sample t-test (testing for evidence that the mean of the sample differs from a specific value) or a two-sample test (testing that means of the samples are different).
- From the menu select
Stats | Sample Size | t-tests. - Fill in the fields as required then click Run.
After running the calculation you can save the results by clicking Save.
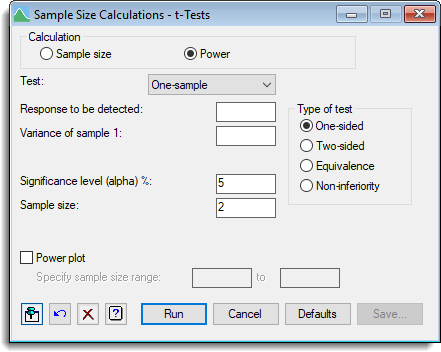
Calculation
Specifies the calculation to be carried out: Sample size, or Power.
Test
Specifies the test to be carried out: One-sample, or Two-sample.
Response to be detected
Specifies the size of response that should be detectable. This is difference between the sample mean of a one-sample test and the specific value, or the difference between the means of the two samples in a two-sample test.
Variance of sample 1
Specifies the variance of the observations in the sample of a one-sample test or of the first sample of a two-sample test.
Variance of sample 2
For a two-sample test, if the second sample has a different variance from the first sample, you can be supply the variance using this option.
Significance level (alpha)%
Specifies the significance level at which the response is to be tested.
Probability of detection (power)%
For a sample size calculation this specifies the required probability for detection of the response (that is, the power of the test).
Sample size
For a power calculation this specifies the sample size to be used to calculate the probability of detection (power).
Replication ratio (sample 2: sample 1)
It is generally assumed that the sizes of the samples in the two-sample test should be equal. However, you can specify a ratio to indicate the size of the second sample in relation to the size of the first sample.
Power plot
When selected, produces a plot of power versus sample size. When Sample size is selected the plot is generated using 11 replication values centred around the required number of replicates for the requested power. When Power is selected you can specify a range of sample size values for the plot in the spaces provided.
Type of test
Lets you choose either a One-sided, Two-sided, Equivalence or Non-inferiority test.
Action Icons
| Pin | Controls whether to keep the dialog open when you click Run. When the pin is down |
|
| Restore | Restore names into edit fields and default settings. | |
| Clear | Clear all fields and list boxes. | |
| Help | Open the Help topic for this dialog. |
See also
- Sample Size Save Options to store the results
- STTEST procedure