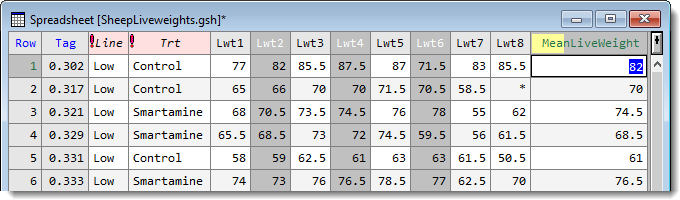
You can calculate summaries across selected columns for each row in the spreadsheet. The summaries may be means, totals, minima, maxima, variances or standard deviations among others. If no columns are selected, you can summarize across all the columns or just columns of a certain type. The calculated results is inserted as a new column into your spreadsheet.
- If you want to summarize a specific set of columns, pre-select these by holding down Ctrl while clicking the column headers.
- From the menu select Spread | Calculate | Row Summaries.
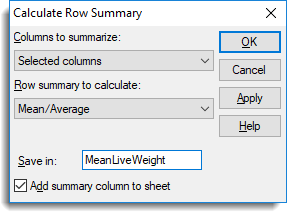
- Select the rows to be used in forming summaries from the dropdown list.
- Select the statistics to calculate.
- Enter a name for the column containing the row summaries then click OK.
The resulting column is coloured half yellow to indicate that this is a calculated column.
Lists the type of columns that can be used in forming the row summaries.
| All numeric columns | All variate and factor columns within the spreadsheet. |
| All variate columns | All variate columns within the spreadsheet. |
| All factor columns | All factor columns within the spreadsheet. |
| Selected columns | The currently selected columns within the spreadsheet. This option is only available when a spreadsheet contains selected columns. |
| Columns in pointer | The columns belonging to a pointer defined within the spreadsheet. This option is only available when a spreadsheet contains pointers. Use the Spread | Sheet | Create pointers menu to define pointers in the spreadsheet. |
The following lists the statistics that can be calculated for each row along with the equivalent function that could be used to perform the same calculation using the CALCULATE directive in the command language.
|
Statistic |
Description |
Genstat command |
|
Sum/Total |
The sum/total of the values in the row. |
|
|
Mean/Average |
The mean of the values in the row. |
|
|
Standard deviation |
The standard deviation of the values in the row. |
|
|
Variance |
The variance of the values in the row. |
|
|
Standard error of means |
The standard error of the row mean. |
|
|
Median |
The median value in the row. |
|
|
Maxima |
The maximum value in the row. |
|
|
Minima |
The minimum value in the row. |
|
|
Range |
The range of the values in the row. |
|
|
No. of observations |
The number of non missing values. |
|
|
Percentile |
The percentile of the values in the row (the percentage should be supplied in the space provided). |
|
|
Quantile |
The quantile of values in the row (the probability should be supplied in the space provided). |
|
|
Position |
The position of a value in the row. The value to find in each row should be supplied in the space provided. This can be the name of another column in the spreadsheet or a number. |
|
|
No. of missing values |
The number of missing values (*). |
|
|
No. of values |
The number of columns. |
|
|
Skewness |
The skewness of the values. |
|
|
Kurtosis |
The kurtosis of the values. |
Percentage (%) (for Summary type Percentile only)
A percentage between 0 and 100% for the calculation of the percentile. Percentages of 0, 25, 50 75, and 100 correspond to the minimum, lower quartile, median, upper quartile and maximum data value respectively.
Probability (for Summary type Quantile only)
A probability between 0 and 1 for the calculation of the quantile. Probabilities of 0, 0.25, 0.5, 0.75 and 1 correspond to the minimum, lower quartile, median, upper quartile and maximum data value respectively.
Find value (for Summary type Position only)
he value to find in each row. This can be the name of a variate or a number.
Save in
The column name to contain the row summaries.
Add summary column to sheet
Add the calculated column to the current spreadsheet.