This menu controls various options relating to the display of three-dimensional surfaces.
- To alter the settings for a surface plot, double-click your graph then click the Surface Options tab.
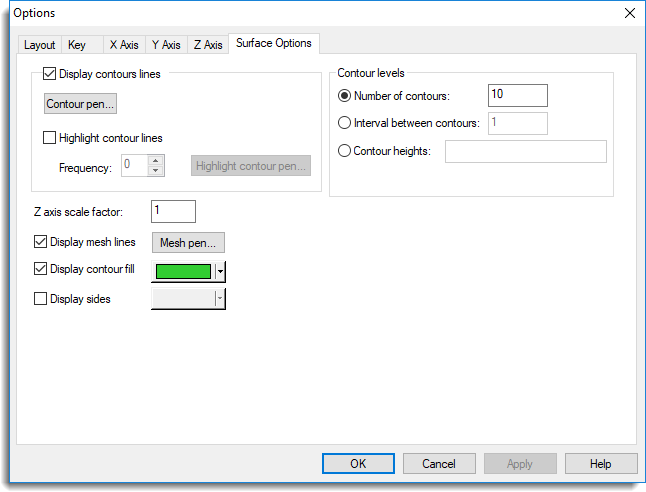
Display contour lines
The surface can be augmented with contour lines joining points with equal Z value. This may help interpretation of the 3-D display. You can modify the contour pen if you want to control the colour or other attributes of the contour lines. The Highlight contour lines option can be used to highlight contour lines using a given interval, i.e. using an interval of 2, every alternative contour line will be drawn using the highlight contour pen.
Contour levels
Specifies how the contour heights are to be drawn. You can enter a list of contour heights (separated by spaces or commas) using the Contour heights option. Alternatively, you can select Interval between contours to specify an interval between each contour or Number of contours to define the exact number of contour lines required.
Z axis scale factor
Use this to control magnification (or shrinkage) of the Z axis, in order to help interpretation of the display.
Display contour fill
Enables or disables colour fill of the surface. The base colour of the contour fill can be modified.
Display mesh lines
The mesh lines represent the X-Y grid upon which the Z values are arranged. Some attributes of the mesh pen can be changed.
Display options
| Surface only | Specifies that just the surface should be plotted |
| Transparent sides | Verticals are added at each corner of the surface to give an impression of height above the XY plane |
| Solid sides | The side faces are filled using the specified colour |