Use this to to control additional options and settings for a Volcano plot of microarray data.
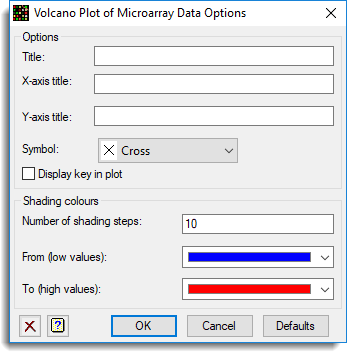
Title
The main title at the top of the graph.
X axis title
The title on the X axis of the graph.
Y axis title
The title on the Y axis of the graph.
Symbol
The symbols to be used for plotting the points in the graph.
Display key in plot
Display a key indicating the slides for a superimposed graph, or the Groups within plots factor levels.
Shading colours
These two colours are used for the points within the Volcano plot. The colour of any point will be a linear blend of the two colours. You select the extreme colours to be used and all other colours will be made as a mixture of these two. For example, with the default low set as blue and the high set as red, intermediate colours will be in purple. The number of shading steps is set by Number of shading steps option.
Number of shading steps
The number of groups to shade. The data are divided into the specified number of equal sized groups using the percentiles of the Shade by variate from the main dialog. The colours are then assigned to the groups using a interpolation between the two colours specified below.
| From (low values) | A dropdown list of colours. Select the colour to be used to identify the lowest group in the plot. |
| To (high values) | A dropdown list of colours. Select the colour to be used to identify the highest group in the plot. |
Action buttons
| OK | Save the options settings and close the dialog. |
| Cancel | Close the dialog without making any changes. |
| Defaults | Reset the options to their default settings. |
Action Icons
| Clear | Clear all fields and list boxes. | |
| Help | Open the Help topic for this dialog. |
See also
- Volcano Plot menu
- MAVOLCANO procedure