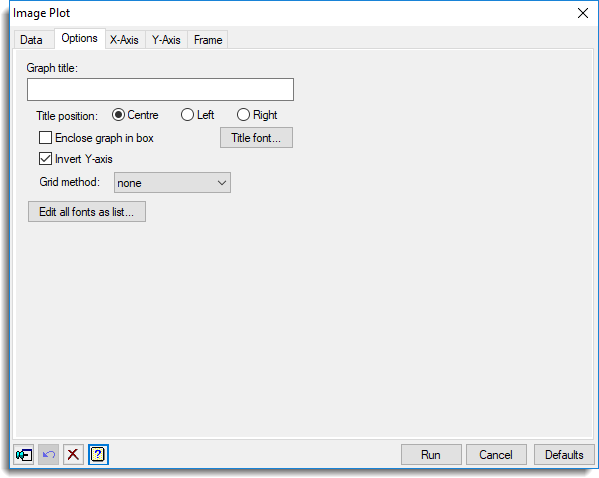
Use this to set attributes to control the appearance of an image plot.
 raph title
Lets you enter a title for the graph. The title appears centred at the top of the graph.
Title position
You can position the title by selecting the Centre, Left or Right option.
Enclose graph in box
Select this to draw an enclosing box around the graph.
Title font
This opens the Edit Font menu that lets you control the font for the title.
Invert Y-axis
This controls the orientation of the y-axis. If this is selected, the y-axis is reversed.
Grid method
Controls whether an outline should be drawn around each element of the data grid. Select Present, if you want to produce an outline for all values that are present; i.e. it ignores missing values. Alternatively, select Complete to draw an outline around every element. If you do not want to draw any outlines, select None.
Edit all fonts as a list
Clicking this opens the Edit All Fonts as a List dialog which allows all the fonts in the graph to be set in one place.
Action buttons
| Run | Produce the graph. |
| Cancel | Close the dialog without further changes. |
| Defaults | Reset options to their default settings. |
Action Icons
| Pin | Controls whether to keep the dialog open when you click Run. When the pin is down |
|
| Restore | Restore names into edit fields and default settings. | |
| Clear | Clear all fields and list boxes. | |
| Help | Open the Help topic for this dialog. |
See also
- Image Plot – data menu
- Edit font dialog
- Edit All Fonts as a List
- DBITMAP directive