Use this to set attributes to control the appearance of the Polar Plot.
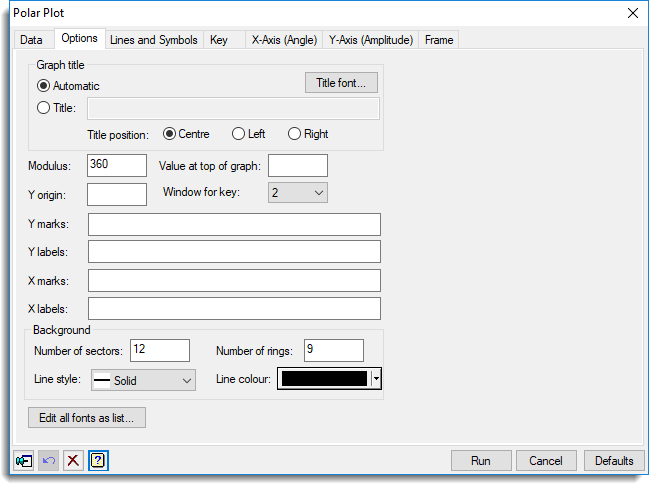
Graph title
If you select Automatic, a title is generated for you using the names of the variates and groups, or if you select Title, you can enter a title for the plot in the space provided. The title appears centred at the top of the graph.
Title font
This opens the Edit Font menu that lets you control the font for the title.
Title position
You can position the title by selecting the Centre, Left or Right option.
Modulus
This is the number representing a full turn or the length of the repeating period. The X values are plotted as the angles 360*MOD(X;modulus) degrees. So for days in a year or a week the modulus will be 365 or 7 respectively, and for months in a year it will be 12.
Value at top of graph
If this is left blank the value of one quarter of the modulus will be plotted at the top of the graph, so that the value 0 is on the right of the graph. Setting this value to another value will put this value at the top of the graph. For example, if plotting months, setting this as 1 will put January at the top of the graph.
Y origin
The Y value at the centre of the circle. If this is left blank, the larger of the minimum of Y and 0 will be used as the Y origin. Values less than the Y origin will not be plotted.
Window for key
For a graph with groups or multiple variates, this gives the window to plot a key in. Setting this to 0 <none> will turn off the key.
Y marks
Provides a space to supply a variate or list of numbers (space or comma delimited), that specify where to plot the rings and tick marks on the y axis.
Y labels
Provides a space to supply a text or list of strings (space or comma delimited), that specify
the labels to use for the tick marks on the y axis. If the strings contain spaces or commas, they must be enclosed by single quotes, e.g. ‘1 Low’,’5 Medium’,’9 High’ etc. The number of labels must match the number of Y marks if both are provided. If the Y marks are not provided, it is assumed that these labels are uniformly spread from the Y origin to the maximum of Y.
X marks
Provides a space to supply a variate or list of numbers (space or comma delimited), that specify where to plot the sectors and tick marks on the rim of the graph.
X labels
Provides a space to supply a text or list of strings (space or comma delimited), that specify
the labels to use for the tick marks on the rim. If the strings contain spaces or commas, they must be enclosed by single quotes, e.g. ‘1 Jan’,’2 Feb’, etc. The number of labels must match the number of X marks if both are provided. If the X marks are not provided, it is assumed that these labels are uniformly spread around the rim of the graph.
Background
The options control how a background grid consisting of rings and sectors are drawn.
Number of sectors
This controls the number or radial lines demarking sectors. To turn off the drawing
of these “spokes”, set this to zero. This will be ignored if X marks or X labels are set.
Number of rings
This controls the number or rings demarking different levels of amplitude that are drawn.
To turn off the drawing of these rings, set this to zero. This will be ignored if Y marks or Y labels are set.
Line style
Lets you select the line style for drawing the background grid.
Line colour
Lets you specify the colour of the lines and circles used in the background grid.
Edit all fonts as a list
Clicking this opens the Edit All Fonts as a List dialog
which allows all the fonts in the graph to be set in one place.
Action buttons
| Run | Produce the graph. |
| Cancel | Close the dialog without further changes. |
| Defaults | Reset options to their default settings. |
Action Icons
| Pin | Controls whether to keep the dialog open when you click Run. When the pin is down |
|
| Restore | Restore names into edit fields and default settings. | |
| Clear | Clear all fields and list boxes. | |
| Help | Open the Help topic for this dialog. |
See also
- Polar Plot – data menu
- Edit font dialog
- Edit All Fonts as a List
- DYPOLAR procedure