Use this to set attributes to control the appearance of the profile plot.
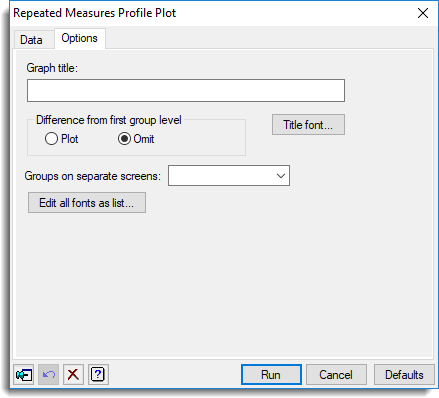
Graph title
Lets you enter a title for the graph. The title appears centred at the top of the graph.
Title font
This opens the Edit Font menu that lets you control the font for the title.
Difference from first group level
Lets you produce a plot of the difference from the first time period. Select Plot if you want to produce a plot of the differences with the first group level of the factor specified to be on the same screen next to the plot of the profiles for the groups. Plots of differences can only be produced if the factor specified in the Groups on same screen option on the Data tab has more than one level. Select Omit if you just want a plot of the profiles.
Groups on separate screens
Lets you specify a factor to control the groupings of the subjects to produce several graphs based on these groupings. For each level of the specified factor a separate graph is produced of the means of the observations at the various levels of the factor specified in the Groups on same screen option on the Data tab. You can either select a factor from the available list of factors or type in the name directly.
Edit all fonts as a list
Clicking this opens the Edit All Fonts as a List dialog, which allows all the fonts in the graph to be set in one place.
Action buttons
| Run | Produce the graph. |
| Cancel | Close the dialog without further changes. |
| Defaults | Reset options to their default settings. |
Action Icons
| Pin | Controls whether to keep the dialog open when you click Run. When the pin is down |
|
| Restore | Restore names into edit fields and default settings. | |
| Clear | Clear all fields and list boxes. | |
| Help | Open the Help topic for this dialog. |
See also
- Repeated measures profile plot data tab menu
- Edit font dialog
- Edit All Fonts as a List
- DREPMEASURES procedure