Use this to set attributes to control the appearance of a Windrose diagram.
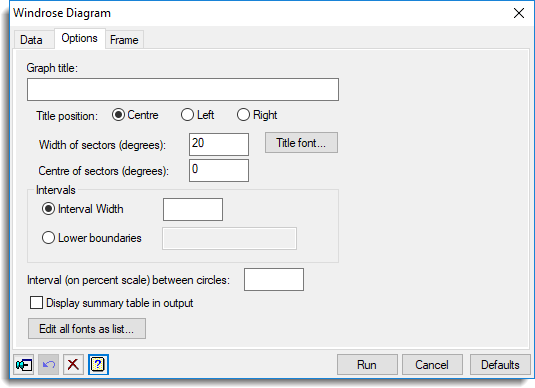
Graph title
Lets you enter a title for the graph. The title appears centred at the top of the graph.
Title position
You can position the title by selecting the Centre, Left or Right option.
Title font
This opens the Edit Font menu that lets you control the font for the title.
Width of sectors (degrees)
Specifies the width of sectors (in degrees) into which to group the angles (when specified as a variate) before plotting
Centre of sectors (degrees)
Defines the centre (in degrees) of the sectors
Intervals
The data values are categorized by determining the number of observations within a set of intervals specified by this option. Select Lower boundaries to supply a variate (or a list of numbers) specifying the lower boundaries of the intervals, or alternatively, select Interval width to supply a value defining boundaries at multiples of the value.
Interval (on the percent scale) between circles
Specifies the interval (on the percent scale) between the circles drawn to provide a scale on the diagram
Display summary table in output
Select this to produce a table of information in the output of the directions by intervals
Edit all fonts as a list
Clicking this opens the Edit All Fonts as a List menu which allows all the fonts in the graph to be set in one place.
Action buttons
| Run | Produce the graph. |
| Cancel | Close the dialog without further changes. |
| Defaults | Reset options to their default settings. |
Action Icons
| Pin | Controls whether to keep the dialog open when you click Run. When the pin is down |
|
| Restore | Restore names into edit fields and default settings. | |
| Clear | Clear all fields and list boxes. | |
| Help | Open the Help topic for this dialog. |
See also
- Windrose data menu
- Edit Font dialog
- Edit All Fonts as a List
- The WINDROSE procedure