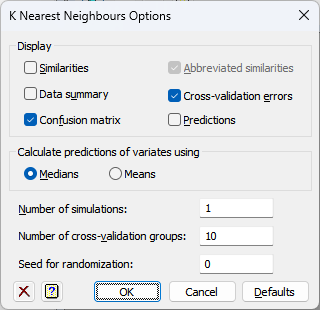
Use this to select different options to be used in constructing the K Nearest Neighbours and the displayed output.

Display
Specifies which items of output are to be displayed in the Output window.
| Similarities | The symmetric matrix of similarities between observations. This may be very large. |
| Abbreviated similarities | This reduces the printing of the similarity matrix to just the first decimal digit (available only when Similarities are selected). |
| Data summary | The list of data variables and their means, minima, maxima and test types. |
| Cross-validation errors | The cross-validation error for all combination of options provided. If the Data to predict is a factor, this is a mean squared error. If is a factor, it is the percentage of observations for which the predictions and observed values do not match. |
| Confusion matrix | The percentage of observations for each observed group allocated to the predicted groups using the optimal combination of options. |
| Predictions | The predicted values for the observations from the rest of the observations using the optimal combination of options. |
Calculate predictions of variates using
This setting controls how the values of the neighbours are summarized when the Data to predict is a variate.
| Medians | The median of the neighbour’s values will be used. |
| Means | The mean of the neighbour’s values will be used. |
Number of simulations
Specifies the number of times the data is split into random cross-validation groups. Increasing this will increase precision but slow down the analysis.
Number of cross-validation groups
Specifies the number of cross-validation groups into which the data are randomly split. Values between 5 and 10 (the default) are reasonable. If this is too low, the cross-validation error may be lower than could be achieved using a full training set, but if set too high the cross-validation error may not reflect the variation in the data set.
Seed for randomization
This gives a seed to initialize the random number generation used for the random selections of variates and units. Using zero initializes this from the computer’s clock, but specifying an nonzero value gives a repeatable analysis.
Defaults
Reset the settings in the dialog to what they were on first opening the dialog.
Action Icons
| Clear | Clear all fields and list boxes. | |
| Help | Open the Help topic for this dialog. |
See also
- K Nearest Neighbours menu.
- K Nearest Neighbours Store dialog.
- K Nearest Neighbours Predictions dialog.
- Form similarity matrix menu.
- Canonical variates analysis menu.
- Stepwise Discriminant Analysis menu.
- Classification Trees menu.
- Regression Trees menu.
- Random Classification Forest menu.
- Random Regression Forest menu.
- Multivariate Analysis of Distance menu.
- Hierarchical Cluster Analysis menu.
- KNNTRAIN procedure.
- KNEARESTNEIGHBOURS procedure.
- FSIMILARITY directive for forming similarity matrices.