Use this to predict the value for a future observation based on the current fitted linear regression model.
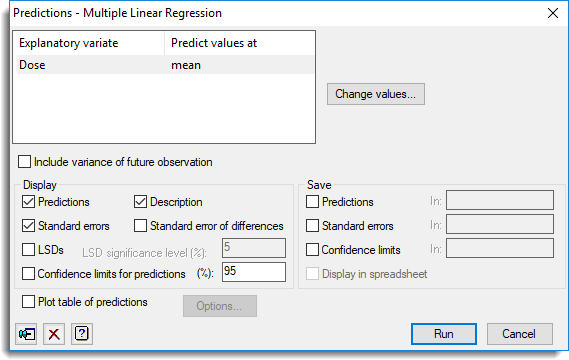
List of explanatory variates
Lists all the explanatory variables in the current regression model along with the value to predict the response variable from. You can change the values to predict the response variable from by either double-clicking on an explanatory variable name or by selecting the names and clicking the Change values button.
| Change values | Opens a window that lets you change the values of the currently selected explanatory variables. |
Include variance of future observation
Specifies whether you want the variance of predictions to be calculated on the basis of forecasting new observations. The default is for the variance of predictions to be calculated on the basis of summarizing the data to which the data has been fitted.
Display
Specifies which items of output are to be produced.
| Predictions | Predictions |
| Description | Describes the standardization policies used when forming predictions |
| Standard errors | Standard errors of predictions |
| Standard error of differences | Standard error of differences between predictions |
| LSDs | Least significant differences between predictions (for ordinary linear regression models or GLMs with Normal distribution only). The LSD significance level (%) can be specified in the space provided. |
| Confidence limits for predictions | Confidence limits for each prediction. The confidence level (%) can be specified in the space provided. |
Save
| Predictions | Table or scalar | Predicted values for each response value |
| Standard errors | Table or scalar | Standard errors for each predicted value |
| Confidence limits | Table or scalar | Confidence limits for each predicted value. The confidence level is that set in the Display section. |
Display in spreadsheet
Display the saved results in a new spreadsheet window.
Plot table of predictions
If this is selected, the predictions will be plotted. The Options button opens the Plot table of predictions dialog which controls how the predictions are plotted.
See also
- Plot table of predictions
- PREDICT directive