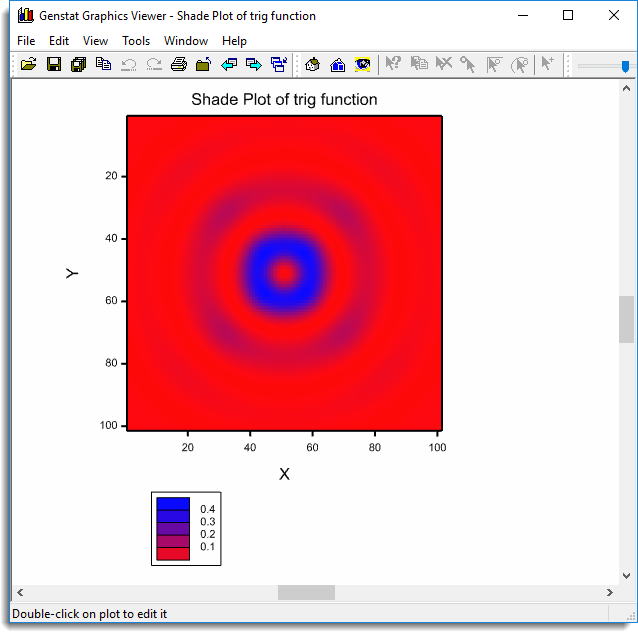
The Genstat Graphics viewer is a program that runs independently of Genstat and displays graphical output. It will start automatically when you generate a graph, and you can switch between Genstat and the graphics viewer at any time. The graphical images are produced in a vector format which is scaled to fit the current size of the Genstat Graphics window, which means that the full resolution will be maintained if the window is resized or printed.

The Genstat graphics format also includes extensive meta-information about the plot and the data contained within it, allowing many aspects to be edited interactively on screen.
The viewer operates in two modes – View and Editor.
Editor mode
To invoke Editor mode, double-click on the plot you wish to edit. The window title and background colour should change to indicate the new mode. You leave Editor mode by using either Save and Close or Close respectively to retain or discard any changes.
Genstat can produce composite graphs, comprising two or more individual components, such as graphs, histograms, and contour plots, in a single display. These types of displays include residual diagnostic plots, trellis plots, and scatter plot matrix. For these composites, the zoom and scroll controls operate on the entire display, whilst the built-in editor operates on individual component plots.
Whilst the viewer can only display a single graph (or composite plot), it maintains a list of graphs as they are generated within Genstat, making it easy to switch the display between the current plot and those generated earlier.
Saving a graph
Individual displays can be saved to Genstat metafiles by selecting File | Save As | Genstat Meta Files. This is a private file format that saves the graph and additional information, so that the graphs can be redisplayed or edited on another occasion, using the Graphics Viewer.
The contents of the Graphics window can also be saved to files in standard graphics formats, such as Enhanced Windows metafiles, bitmaps, JPEG, PostScript, and PNG. To do this, from the menu select File | Save As then select a file type from the dropdown list.
If the Graphics Viewer has become hidden under other windows you can re-display it by clicking the toolbar button: ![]()
Genstat graphics can also be saved directly to the various graphical file formats using the DEVICE and OPEN statements in command mode. The DHELP command lists the device numbers associated with each format.
The current Genstat metafile format is upwards compatible with the revisions introduced in the Fifth Edition of Genstat. Thus, GMF files saved from the Fifth to Seventh Editions can be opened using the File | Open menu, with minimal changes in appearance. The main differences are likely to be the removal of Invert B/W and improved line style support which may produce minor changes to dashed or dotted lines. The displays can be edited, saved and printed as normal. Note that metafiles saved by the current version cannot be loaded into older versions of Genstat.
Older, “4.1 format” metafiles can also be displayed in the graphics viewer. These graphs cannot be edited but can be printed and exported in other formats.