Form doubly resolvable row-column designs, with output (D.B. Baird).
Options
PRINT = string tokens |
Controls printed output (design, plotnumbers, factors, efficiency; default desi, effi |
DESIGNPLOT = string token |
What factors to display in the design plot (treatment, plotandtreatment); default * i.e. no plot |
FIRSTPLOT = string token |
Defines the starting location for allocating plots to the row-by-column grid (lowleft, lowright, upleft, upright); default uple |
PLOTORDER = string token |
Defines the order in which the blocks are filled (colserpentine, colbycol, rowserpentine, rowbyrow); default rowb |
TIME = scalar |
Time in seconds to spend searching for an optimal design; default 60 |
SEED = scalar |
Seed for the randomization; default 0 |
MAXITERATIONS = scalar |
The number of random designs to search for an optimal design; default 10000 |
SPREADSHEET = string tokens |
What to save in a spreadsheet (data, plan); default * |
Parameters
NROWS = scalars |
Number of rows in the layout of each design |
NCOLUMNS = scalars |
Number of columns in the layout of each design |
LEVELS = scalar, variate or text |
Defines the number of levels or labels of the TREATMENT factor for each design |
TREATMENTS = factors |
Saves the treatment allocation in each design |
ROWREPLICATES = factors |
Saves the row replicates in each design |
COLREPLICATES = factors |
Saves the column replicates in each design |
ROWS = factors |
Saves the row locations of the plots in each design |
COLUMNS = factors |
Saves the column locations of the plots in each design |
PLOTNUMBERS = factors |
Saves the plot numbers |
TITLE = texts |
The title for the design plot; default an automatic description of the design |
OUTFILE = texts |
Gives a file name (with extension .gsh, .gwb, or .xlsx) to save the factors in each design |
EXIT = scalars |
Saves the exit code from the design search program (0 for success, greater than 0 for failure) |
Description
AFRCRESOLVABLE creates approximately optimal row-column designs. They are formed into replicates in both the row and column directions so that they are doubly resolvable, i.e. resolvable in both row and column directions. The layout of plots must be a complete rectangular array, and the treatments must be equally replicated. This requires that the number of rows multiplied by the number of columns in the array must be equal to the number of treatments multiplied by the number of replicates. The row replicates consist of units in adjacent rows, and the column replicates consist of units in adjacent columns. This design can be thought of as a generalization of a Latin square, with each treatment occurring once in each row and column replicate.
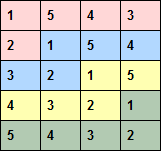
An example design with four replicates of five genotypes in a five-row by four-column array is shown below. As the number of treatments is the same as the number of rows, the column replicates are the same as the columns, so each treatment occurs once in each column. The row replicates are shaded in different colours and consist of five plots from adjacent rows. This is the optimal design, as the treatments in the five rows form a balanced incomplete block design (within the rows, each treatment occurs three times with every other treatment).
The number of rows and columns in the row-column array must be specified by the NROWS and NCOLUMNS parameters respectively. The number of treatments is specified by the LEVELS parameter, either as a scalar (defining the number explicitly), or as a variate giving the levels for the treatments, or by a text defining a name for each treatment. The maximum number of rows, columns or treatments is 4000, with at most 8000 plots in the array, and the maximum number of replicates is 20. There must be at least two rows, columns, treatments and replicates in the design. The number of columns must be less than or equal to the number of treatments. The number of rows can be greater than the number of treatments. It must then be a multiple of the number of treatments, and multiple replicates are stacked in the columns.
The PLOTNUMBER parameter saves the plot numbers, in a factor. The FIRSTPLOT option specifies where the numbering should start, as follows:
lowleft |
left-hand plot at the bottom of the design, i.e. in the final row and first column; |
lowright |
right-hand plot at the bottom of the design, i.e. in the final row and final column; |
upleft |
left-hand plot at the top of the design, i.e. in the first row and first column (default); |
upright |
right-hand plot at the top of the design, i.e. in the first row and final column. |
The PLOTORDER option defines the order in which the row or column replicates are formed and the order the plots are numbered from the first plot:
colserpentine |
column-by-column in a serpentine way, e.g. top-to-bottom, and then bottom to top; |
colbycol |
column-by-column taking the same direction for every column; |
rowserpentine |
in a serpentine way, e.g. left-to-right, and then right-to-left; |
rowbyrow |
row-by-row taking the same direction for every row (default). |
The TIME option (default 60 seconds) specifies the maximum time in seconds to spend searching for an optimal design. For large designs, TIME should be increased. For example, 1000 seconds is recommended for more than 100 treatments, and 4000 seconds for more than 200 treatments.
The SEED parameter specifies the starting seed for the randomization process; the default of zero initializes the seed automatically.
The MAXITERATIONS option (default 10000) sets the maximum number of random starting designs to use in the search. The search stops when either the TIME or the MAXITERATIONS limit is reached.
The factors for the resulting design can be saved by the TREATMENTS, ROWREPLICATES, COLREPLICATES, ROWS and COLUMNS parameters.
The EXIT parameter can save a scalar which is set to 0 if the design search has found a valid design, 1 if the design limits have been exceeded, 2 if a design is not possible, 3 if no design has been found, and 9 if not enough memory could be allocated for the design search.
Printed output is controlled by the PRINT option, with settings:
design |
to print treatments in the design in a row-column layout; |
plotnumbers |
to print the plot numbers in a row-column layout; |
factors |
to print the design factors for the best design; and |
efficiency |
to print the combined design efficiency (using row and column replicates, rows and columns as fixed terms) for the design. |
The design can be displayed in a spreadsheet using the SPREADSHEET option: the data setting creates a sheet containing the design factors (plot numbers, rows, columns, row replicates, column replicates and treatments); plan setting will display the plot numbers and treatments in a rectangular array in a sheet. The spreadsheet can be saved to a file if the OUTFILE parameter specifies a Genstat or Excel spreadsheet filename (.gsh, .gwb or .xlsx).
The design layout can be plotted in graph using the DESIGNPLOT option: the treatment setting just displays the treatments in each cell in the array; plotandtreatment displays both the plot numbers and treatments. The row and column replicates are demarked in the graph by blue and red lines respectively. The title for this graph can be set with the TITLE parameter. If this not set, a descriptive title will be created from the design parameters.
Options: PRINT, DESIGNPLOT, FIRSTPLOT, PLOTORDER, TIME, SEED, MAXITERATIONS, SPREADSHEET.
Parameters: NROWS, NCOLUMNS, LEVELS, TREATMENTS, ROWREPLICATES, COLREPLICATES, ROWS, COLUMNS, PLOTNUMBER, TITLE, OUTFILE, EXIT.
Method
The procedure calls the directive AGRCRESOLVABLE to form the design which is chosen to optimise the row-column efficiency using the MS criterion (Shah 1960). The procedure FPLOTNUMBER is used to form the plot numbers and the procedure AEFFICIENCY to calculate the design’s efficiency. The ADSPREADSHEET procedure is used to save or display the design in a spreadsheet.
Reference
Shah, K.R. (1960). Optimality criteria for incomplete block designs. Annals of Mathematical Statistics, 22, 235-247.
See also
Directive: AGRCRESOLVABLE.
Procedures: ADSPREADSHEET, AEFFICIENCY, DDESIGN, FPLOTNUMBER.
Commands for: Design of experiments.
Example
CAPTION 'AGFCRESOLVABLE Examples'; STYLE=meta

"Simple design of 5 treatments in 5 rows by 4 columns (gives a Youden square)"
AFRCRESOLVABLE [PRINT=design,factors; SEED=2637] NROWS=5; NCOLUMNS=4; \
         LEVELS=5; TREAT=Treat; ROWS=Row; COLUMNS=Column

"15 Genotypes x 4 replicates in 10 x 6 array"
TEXT     [VALUES='AB14.33','AB15.1','AB15.32','AB18.1','AB19.2','AB19.27', \
         'AB21.3','AB21.7','AB25.9','AB27.1','AB27.3','AB27.7','AB31.9',\
         'AB31.11','AB32.4'] Gtype
AFRCRESOLVABLE [PLOTORDER=rowserpentine; SEED=12457; SPREADSHEET=data,plan] \
         NROWS=10; NCOLUMN=6; LEVELS=Gtype; TREATMENTS=Genotype; \
         ROWREPLICATES=RowRep; COLREPLICATES=ColRep; ROWS=Row; \
         COLUMNS=Column; PLOTNUMBER=Plot

"16 cultivars in a 8 x 8 array (pairs of rows & columns make replicates)"
TEXT     [VALUES='Apollo','Bumper','Chronicle','Diamond','Earner','Fleet',\
         'Golden','Hunter','Inferno','Jimpy','Karamu','Kingdom','Magnum',\
         'Orator','Phoenix','Queen'] Names
AFRCRESOLVABLE [PRINT=design,plotnumbers,efficiency,factors; \
         FIRSTPLOT=lowleft; PLOTORDER=colserpentine; SEED=75421; \
         MAXITERATIONS=20000; DESIGN=plotandtreatment] \
         NROWS=8; NCOLUMNS=8; LEVELS=Names; \
         TREATMENTS=Cultivar; ROWREPLICATES=RowRep; COLREPLICATES=ColRep; \
         ROWS=Row; COLUMNS=Column; PLOTNUMBER=Plot

"Create dummy data"
CALC [SEED=573] Yield = NEWLEVELS(RowRep;CUMULATE(GRNORMAL(4;0;1))) + \
                        NEWLEVELS(ColRep;CUMULATE(GRNORMAL(4;0;1))) + \
                        NEWLEVELS(Row;CUMULATE(GRNORMAL(8;0;1))) + \
                        NEWLEVELS(Column;GRNORMAL(8;0;0.5)) + GRNORMAL(64;9;1)

"Analyse dummy data by ANOVA removing both rows and column replicates effects
as in this design these are both orthogonal to treatments as they are
comprised of full rows and columns - however most designs are not orthogoanal"
BLOCKS RowRep + ColRep
TREAT Cultivar
ANOVA [FPROB=yes] Yield

"Analyse data by automatic REML"
VAROWCOLUMN [PBEST=model,means,components; FIXED=Cultivar; RANDOM=ColRep; \
    REPLICATES=RowRep; ROWS=Row; COLUMNS=Column; PLOTFACTOR=Plot; \
    VCONSTRAINTS=positive; RSTRATEGY=optimal] Yield