This option allows you to embed commands within a spreadsheet so that you can repeat the same analysis more conveniently with a different data set. This method can also simplify analysis for a user who may not be familiar with the correct way to specify the statistical analysis; a novice user can be given the .gsh file containing the design columns and they can just add in the data columns as collected, then use the menu to get the correct analysis.
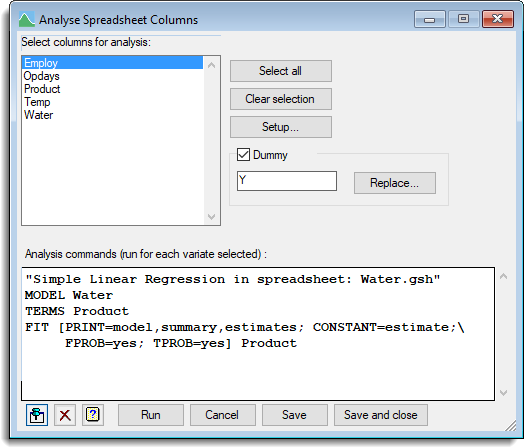
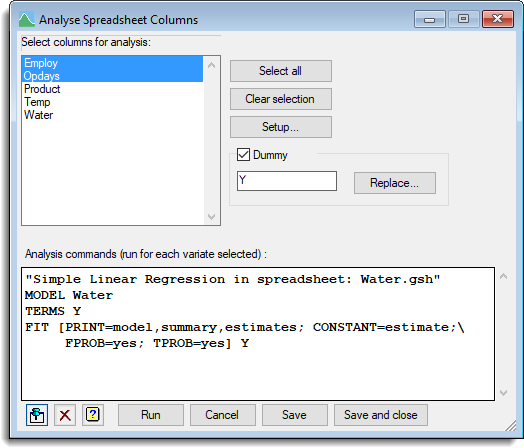
There are two sections of Genstat directives: the Setup section that is accessed by clicking Setup (these commands are run once only) and the Analysis commands section, which is run once for each selected column using a FOR directive. The Dummy field specifies the name of the dummy variable used by the FOR loop. The selected columns in the Select columns for analysis list are used as the list of variables in the FOR statement.
- Open the spreadsheet you want to embed commands within then select Spread | Sheet | Analysis.
- Either type or cut and paste your analysis commands into the lower section.
(For a full list of available commands refer to the Introduction to Genstat Command Language pdf, which is available by selecting Help | Genstat Guides | Introduction to Genstat Command Language). - To set the commands to refer to an arbitrary explanatory variate (denoted by the dummy ‘Y’) click Replace then type the variate name.
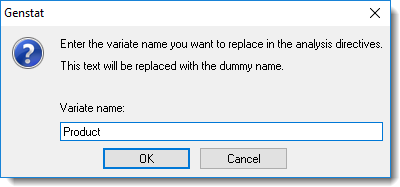
- Click OK. This replaces the variate name with the dummy name in the Analysis commands section.
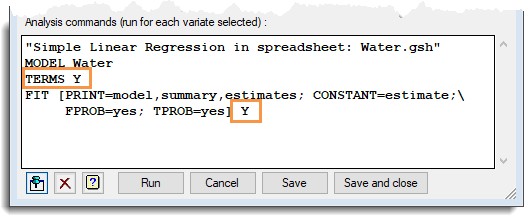
- To store the commands with the spreadsheet click Save and close.
You can now run this analysis at any time. - To run the analysis on specific columns, re-open the window by selecting Spread | Sheet | Analysis.
- Select one or more columns then click Run.
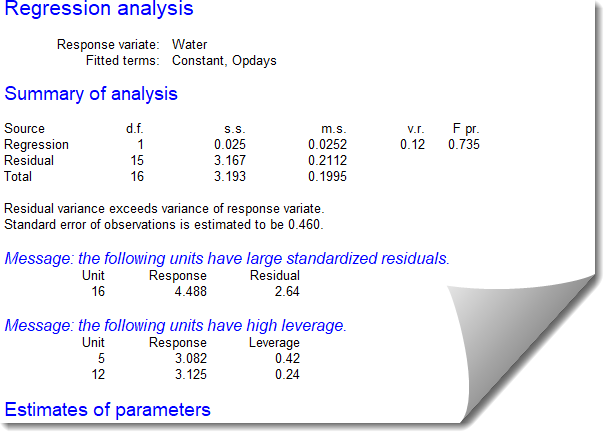
The results will be displayed in the Output window for each column you selected.