Select menu: Stats | Bootstrap
Use this to perform bootstrap resampling to generate a distribution for a specified statistic.
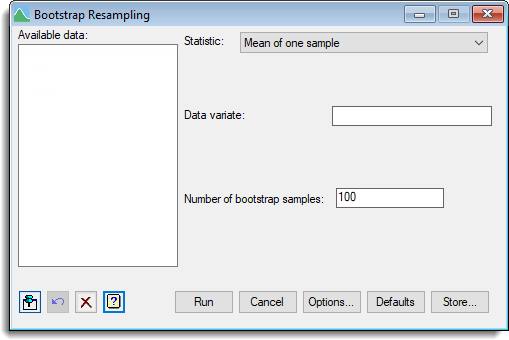
- After you have imported your data, from the menu select
Stats | Bootstrap. - Fill in the fields as required then click Run.
You can set additional Options before resampling and store the results by clicking Store.
The bootstrap is a method of providing distributional information, such as standard errors, about statistical estimates without making precise distributional assumptions about the data. It can also provide estimates with reduced bias. This is achieved by “resampling” from the data; that is, generating new data sets by sampling with replacement from the data set being investigated.
The original data is resampled with replacement to form a number of data sets of the same size as the original data set. The statistics are calculated for each simulated data set and a distribution of these statistics is then built up. The means, standard errors and confidence limits of the statistics are then estimated from this distribution. The results can be saved and displayed in a spreadsheet using the store menu. Additional options to control aspects of the output and bootstrapping options can be selected using the options.
This menu provides a list of some standard statistics that are to be bootstrapped. However, the Genstat command language code that is generated in the Input Log by the menu could be used as template for other statistics. When an analysis is run a procedure called RESAMPLE is automatically generated for the selected statistic and this is used by the BOOTSTRAP procedure to perform the bootstrapping. To perform bootstrapping for a statistic not provided on this menu you will need to create your own RESAMPLE procedure in command mode. The BOOTSTRAP procedure provides help on writing the RESAMPLE procedure and further references.
Available data
This lists data structures appropriate to the current input field. It lists either factors for specifying the groups, or variates for specifying the data. The contents will change as you move from one field to the next. Double-click on a name to copy it to the current input field or type the name.
Statistic
| Mean of one sample | The mean of a single variate given in the Data variate field. |
| Median of one sample | The median (middle value) of a single variate given in the Data variate field. |
| Standard deviation of one sample | The standard deviation of a single variate given in the Data variate field. |
| t-test of one sample | The t-test statistic of a single variate given in the Data Variate field compared with a mean specified in the Test mean field. |
| Difference between means of two samples | The difference between means of samples where data are supplied by either two variates or a single variate with a group factor. The difference is evaluated as the mean of group 1 – mean of group 2. |
| Difference between medians of two samples | The difference between medians of samples where data are supplied by either the two variates or a single variate with a group factor. The difference is evaluated as median of group 1 – median of group 2. |
| t-test of two samples | The t-test of the difference between means of samples where data are supplied by either two variates or a single variate with a group factor. The difference is evaluated as the mean of group 1 – mean of group 2. For paired data the difference is evaluated as the mean (group 1 – group 2) – 0. The type of test (one or two sided) is controlled in the options dialog. |
| t-test of paired samples | The t-test of the difference between paired samples where data are supplied by two variates. The difference is evaluated as the mean(group 1 – group 2) – 0. The type of test (one or two sided) is controlled in the options dialog. |
| Correlation | The linear correlation coefficient between two variates given in the Data variate 1 and Data variate 2 fields. |
| Linear regression | The slope and constant from a straight line regression between two variates given in the Response variate (Y) and Explanatory variate (X) fields. |
Data arrangement
For a two-sample statistic the data can be supplied either as a pair of variates or as a single variate with a factor defining the groups.
| Two variates | The samples must be supplied as two separate variates, whose names should be entered as Variate for first sample and Variate for second sample. |
| One variate with group factor | The data must be supplied in one variate, specified in the Data variate field. Membership of the two samples is then indicated by a groups factor whose name should be entered in the Groups factor field. |
Compare group with
When the Data arrangement is set to One variate with group factor and a factor has been selected this option will be active. Each of the groups within the factor will be displayed in two dropdown lists and you can choose which two groups to compare by selecting them from these lists. The statistic is then evaluated by subtracting the second group from the first group.
Number of bootstrap samples
Number of times to resample the data in forming the bootstrap distribution of the statistics.
Test mean (one-sample t-test only)
Specifies the mean for the null hypothesis of a one-sample t-test.
Estimate of variance (t-test of two samples only)
For a two-sample t-test you can choose the method which is to be used to estimate of variances for the test statistic.
| Automatic | Uses a pooled estimate unless there is evidence of unequal variances. |
| Pooled | Always uses a pooled estimate of the standard deviation for the test. |
| Separate | Estimate the standard deviation for the test using separate variances. |
Action Icons
| Pin | Controls whether to keep the dialog open when you click Run. When the pin is down |
|
| Restore | Restore names into edit fields and default settings. | |
| Clear | Clear all fields and list boxes. | |
| Help | Open the Help topic for this dialog. |
See also
- Bootstrap options for choosing options
- Bootstrap store options for choosing the results to save
- BOOTSTRAP procedure in command mode