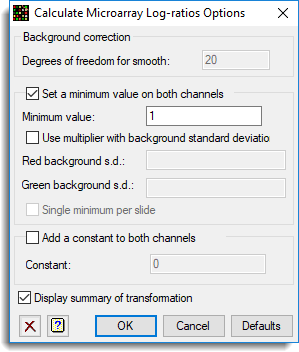
Use this to set additional options and settings for the Calculate Microarray Log-ratios menu.
Background correction – Degrees of freedom for smooth
This option is enabled if the Smooth background values option has been set on the main menu. This specifies the degrees of freedom used in the function that smooths the background red and green values. A small value for the degrees of freedom will create a smoother but less responsive surface for each colour. A large value will create a rougher, more variable surface that is able to respond to short term trends.
Set a minimum value on both channels
This option is used to retain information on spots where the foreground is below the background value on one colour. If this option is not set, then if one colour’s foreground is below the background, the log-ratio will be made missing despite the value of the other channel, thus potentially missing a probe with a high level of differential expression. Some image analysis packages set a very large constant log-ratio for this, but this can bias the results as no differentiation is made between cases where the other colour is just above background, and other cases where the other colour is significantly above background.
This option can also be used to reduce variability at the low end of the intensity range, as often the ratios become unstable as the foreground gets close to the background level.
Minimum Value
This is the value that will be used as a minimum value for both channels/colours. If the Use multiplier with background standard deviations option is selected, this value will be multiplied by the background standard deviations.
Use multiplier with background standard deviations
When selected, the background standard deviation for each colour is multiplied by the Minimum value, so that the minimum depends on the quality of the background around each spot.
Red background s.d.
The variate containing the standard deviation of red background around each spot.
Green background s.d.
The variate containing the standard deviation of green background around each spot.
Single Minimum per Slide
The minimum values per spot depending on the background standard deviations are averaged over the whole slide and this single value is used for each channel. This lets each slide have its own minimum, depending on how clean the background values are. Slides with highly variable backgrounds will have larger minimum values applied.
Add a constant to both channels
This option can also be used to reduce variability at the low end of the intensity range, as often the ratios become unstable as the foreground gets close to the background level. Adding a constant to both red and green will stabilise the log-ratios at low intensities, but with a potential loss of sensitivity for detecting differential expression. The constant is specified in the Constant field, and this would normally be a positive value, although a negative value could be used you believe that the image analysis package is underestimating the background values.
Display summary of transformation
Display the 10th, 25th, 50th, 75th and 90th percentiles of the log-ratios for each slide within the Output window.
Action buttons
| OK | Store the options and close the dialog. |
| Cancel | Close the dialog without making any changes. |
| Defaults | Reset the options to their default settings. |
Action Icons
| Clear | Clear all fields and list boxes. | |
| Help | Open the Help topic for this dialog. |
See also
- Calculate Microarray Log-ratios menu
- Microarray Menus
- MACALCULATE procedure