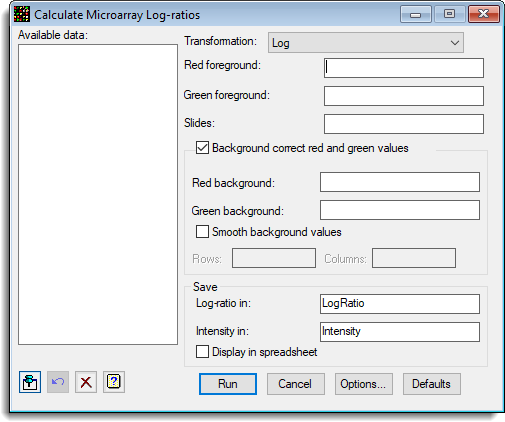
Select menu: Stats | Microarrays | Calculate | Log-ratios
Use this to calculate the log-ratios from a two channel microarray.
- After you have imported your data, from the menu select
Stats | Microarrays | Calculate | Log-ratios. - Fill in the fields as required then click Run.
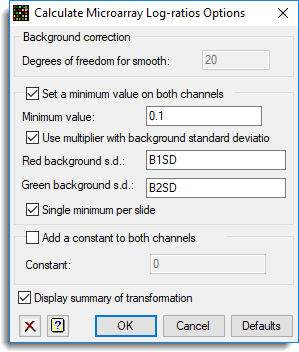
You can set additional Options before running the analysis by clicking Options.
There are options for background correction and setting the channels to a minimum value to avoid large variation when the values in either channels get close to zero. The ratios are logged as the variation usually increases with the size of the mean. However, although the variation may be more uniform with the logged ratios, it may still show considerable heterogeneity with different levels of intensity.
The intensity of a spot is defined as:
Intensity = (LOG(Red) + Log(Green))/(2*LOG(2))
Available data
This lists data structures appropriate to the current input field. Double-click a name to copy it to the current input field or type the name.
Transformation
| Log | log-ratio = log(Red/Green) |
Red foreground
The variate containing the values of the red/Cy5 foreground for each spot. Note: Cy5 is the technical name for the red fluorescent dye.
Green foreground
The variate containing the values of the green/Cy3 foreground for each spot. Note: Cy3 is the technical name for the green fluorescent dye.
Background correct red and green values
When selected, the level of the background (specified in the fields provided) will be subtracted from the foreground levels before taking the log-ratios.
Red background
The variate containing the values of the red/Cy5 background around each spot. This is only required if background correction is to be performed.
Green background
The variate containing the values of the green/Cy3 background around each spot. This is only required if background correction is to be performed.
Smooth background values
When selected, this performs a two dimensional smooth of the background values and uses the smoothed values for the correction, rather than just using the individual background for each spot which may be more variable than a smoothed value. Note that this can be time consuming for large slides. If this is selected the Rows and Columns must be provided.
Rows
A factor indexing the rows over the whole slide. Note that care must be taken not to provide a factor that only indexes the rows within a pin.
Columns
A factor indexing the columns over the whole slide. Note that care must be taken not to provide a factor that only indexes the columns within a pin.
Save
Lets you specify names to store the results.
| Log-ratio | Variate | The calculated log-ratio or generalized log-ratio transformation of the red and green values for each spot |
| Intensity | Variate | The intensity of each spot |
Display in spreadsheet
Select this to display the results in a spreadsheet.
Action buttons
| Run | Run the analysis. |
| Cancel | Close the dialog without further changes. |
| Options | Opens a dialog where additional options and settings can be specified for the analysis. |
| Defaults | Reset the options to their default settings. Clicking the right mouse on this button produces a shortcut menu where you can choose to set the options using the currently stored defaults or the Genstat default settings. |
Action Icons
| Pin | Controls whether to keep the dialog open when you click Run. When the pin is down |
|
| Restore | Restore names into edit fields and default settings. | |
| Clear | Clear all fields and list boxes. | |
| Help | Open the Help topic for this dialog. |
Example
This example shows the settings within the menu that can be used to calculate log-ratios from a GenePix file:
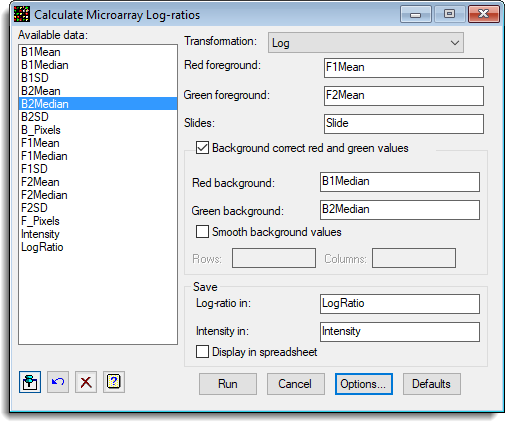
Additional options can be specified as follows:
See also
- Calculate Microarray Log-ratios Options
- Microarray Menus
- Two Channel Microarray Design
- Open Microarray Data Files
- Histograms, density plots, spatial plots and 2D plots for visualizing microarray data
- Normalize 2 Channel Microarray
- Estimates from Log-ratios
- Empirical Bayes Estimates
- False Discovery Rate using Mixture Model
- Volcano Plot
- Cluster Probes/Genes
- Cluster Targets/Slides
- Two-way Clustering
- Microarray procedures
- MACALCULATE procedure