Select menu: Stats | Microarrays | Design | Check Two Channel Design
Use this to check a design for a two colour microarray experiment. The design is generated by deciding which pairs of targets to allocate to each slide. The design is equivalent to an incomplete block design with blocks of size 2 where each slide is a block.
- From the menu select
Stats | Microarrays | Design | Check Two Channel Design. - Specify the treatment contrasts then click Run.
You can generate a range of standard microarray designs using the Generate Two Channel Design menu. Note that designs should be saved from this menu in the format where the treatments are in different columns.
If dye bias is allowed for, then the dye effects must also be estimated, and the pattern of allocation of targets to dye must also be allowed for. In general, you can take a particular incomplete block design, and allocate the pairs of targets so that across the design each target is allocated as equally as possible to the two dyes. Any imbalance of the number of times a treatment is allocated to the dyes will cause a loss of efficiency (dye bias is where the dye binds to the probe, so that for example its spot will turn red despite which target is bound to the red (Cy5) or green (Cy3) dye. If a dye swap pair (two slides with the same target allocation, but one has the reverse dye allocation of the other) has log-ratios of the same sign for a spot, then this is an indication that a particular dye has preferentially bound to the spot, rather than the target binding to the spot.
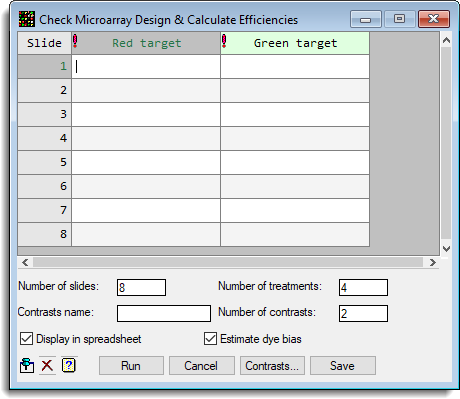
To check a design, specify the number of treatments/targets and slides in your experiment, and then enter the targets allocations on each slide and dye. Specify any particular treatment contrasts you are interested in, and then click the Run button to display the efficiencies in the Output window, and optionally in spreadsheets.
Number of slides
The number of slides to be used in the experiment. Changing this will increase or decrease the number of rows in the spreadsheet. Not all the rows may be displayed at one time in the spreadsheet, but the scroll bar or arrow keys will allow you to scroll the slides into view.
Contrasts name
The name of a matrix containing contrasts in each row. You can create a contrast matrix by clicking the Contrasts button.
The contrasts matrix has a column for each treatment, and a row for each contrast. The values in each row should add to zero, and specify the numbers that the corresponding treatment means are multiplied by before being summed. The contrasts do not need to be orthogonal and are not standardized before use.
Examples of Contrast matrices
The following illustrate 3 types of contrasts and how the contrast matrices are setup to estimate these contrasts.
Comparing the mean of two treatments with another treatment
| Treatment | A | B | C | D |
| A vs B,C |
-2
|
1
|
1
|
0
|
2 x 2 Factorial treatments structure – main effects and interaction
| Treatment | A1B1 | A1B2 | A2B1 | A2B2 |
| A main effect |
-1
|
-1
|
1
|
1
|
| B main effect |
-1
|
1
|
-1
|
1
|
| A×B interaction |
-1
|
1
|
1
|
-1
|
Polynomial contrast for 4 treatments with uniform spacing
| Treatment | T1 | T2 | T3 | T4 |
| Linear |
-3
|
-1
|
1
|
3
|
| Quadratic |
1
|
-1
|
-1
|
1
|
| Cubic |
-1
|
3
|
-3
|
1
|
The procedure ORTHPOLYNOMIAL can be used to generate the values needed to define a set of orthogonal polynomials with any spacing of points.
Number of treatments
The number of targets to be used in the experiment. After the targets are allocated to each slide and dye, a check is performed to ensure that there are the specified number of distinct targets in the design. If there is a mismatch you can either, update the number of slides, or correct any spelling mistakes for the target names in the design spreadsheet.
Number of contrasts
The number of contrasts that will be created in the matrix when creating the matrix using the Contrasts button. This does not need to be specified if the matrix already exists.
Display in spreadsheet
Display the resulting standard errors of differences between treatments, and contrast standard errors in spreadsheets.
Estimate dye bias
In the calculation of the standard errors, include in the model the estimation of dye bias.
Action buttons
| Run | Run the analysis. |
| Cancel | Close the dialog without further changes. |
| Contrasts | Create a contrast matrix in a spreadsheet using the name specified in the Contrasts name field, and number of contrasts (i.e. rows in matrix) as specified in the Number of contrasts field. If either the contrast matrix name or number of contrasts are not specified you will be prompted for these. |
| Save | Save the design in a spreadsheet. You will need to save the spreadsheet that is created to a file to keep a permanent record of the design. |
Types of designs
Common reference designs
A common reference design compares all the treatments with a single treatment or common reference.
Example common reference design
This experiment compares the standard A with every other treatment (B,C,D).
| Slide | Red | Green |
| 1 |
A
|
B
|
| 2 |
A
|
C
|
| 3 |
A
|
D
|
Loop designs
In these designs the treatments flow from one slide on to another with one treatment moving to the next slide, but changing dye, and a new one being introduced. When the treatments are exhausted, the treatment on the first slide is put on the final slide to provide a loop back to the first slide. For three treatments, this is equivalent to the balanced incomplete block design. One property of this design is that they must be balanced on the two dyes as each treatment occurs twice in each loop, one on each dye.
Example loop design
This experiment compares every treatment of A,B,C,D with every other treatment.
| Slide | Red | Green |
| 1 |
A
|
B
|
| 2 |
B
|
C
|
| 3 |
C
|
D
|
| 4 |
D
|
A
|
Balanced incomplete block designs
A balanced incomplete block design compares each treatment with every other treatment an equal number of times.
Example balanced incomplete block design
This experiment compares every treatment of A,B,C,D with every other treatment. Note that as each treatment occurs 3 times, they cannot be completely balanced for dye, but are even as possible occurring once on one dye and twice on the other.
| Slide | Red | Green |
| 1 |
A
|
B
|
| 2 |
C
|
A
|
| 3 |
A
|
D
|
| 4 |
B
|
C
|
| 5 |
D
|
B
|
| 6 |
C
|
D
|
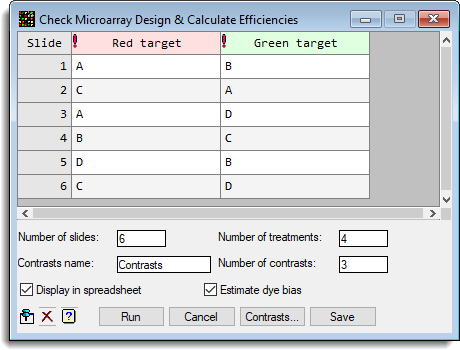
Example
The design given for the incomplete block design above is to be evaluated. This has 4 treatments and 6 slides. The treatments A,B,C,D are actually a 2 x 2 factorial with A & B being low on one treatment 1, and C & D high, and A & C low on treatment 2 and B & D high.
The following dialog shows the details for this design entered:
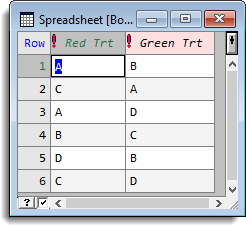
Clicking the Contrasts button allows the following matrix to be created which specifies the main effects and interactions.
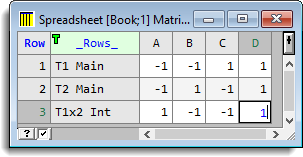
We’ve edited the rows labels from the default Contrasts to some more informative text and entered the values of the contrasts. The column labels are generated by default from the Red and Green Target data that has already been entered in the dialog.
Clicking the Run button, with the Display in Spreadsheet option checked creates the following spreadsheets containing the results:
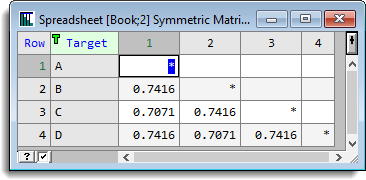
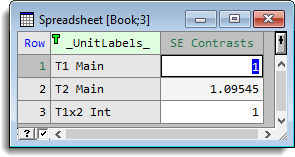
Note: these standard errors are based on a residual mean square of 1.
Clicking the Save button will create a spreadsheet containing the design:
The Output window will also contain these results and also the treatment variance-covariance matrix. From this, as Estimate dye bias has been selected we can see that there is some confounding between the Dye and treatment effects, as the Dye Row in the variance-covariance matrix has non-zero covariances. When the treatments are balanced for the two dyes, these covariances are zero.
Microarray Design Efficiencies

Microarray Design

     Slide   Red_Trt	Green_Trt
	1	A	B
	2	C	A
	3	A	D
	4	B	C
	5	D	B
	6	C	D

Variance Covariance Matrix

	A	  0.2000
	B	  -0.0750	  0.2000
	C	  -0.0500	  -0.0750	  0.2000
	D	  -0.0750	  -0.0500	  -0.0750	  0.2000
	Dye	  -0.0500	  0.0500	  -0.0500	  0.0500	  0.2000
     		     A	             B	             C	            D	            Dye

Standard Errors of Differences

	A	*
	B	  0.7416	*
	C	  0.7071	  0.7416	*
	D	  0.7416	  0.7071	  0.7416	*

     		    A	             B	            C	        D

Summary Statistics of SEDs

	Minimum	  Mean	 Maximum
	0.7071	  0.7301	  0.7416

Standard Errors of Contrasts

	T1 Main	  1.0000
	T2 Main	  1.0954
	T1x2 Int	  1.0000