Select menu: Stats | Microarrays | Analyse | Estimate Two Channel Effects
Use this to estimate effects from the within slide differences between targets. This information is contained in the log-ratios. Usually, these log-ratios will be normalized using the Normalize Two Channel Microarray Data menu.
- After you have imported your data, from the menu select
Stats | Microarrays | Analyse | Estimate Two Channel Effects. - Fill in the fields as required then click Run.
You can set additional Options before running and store the results by clicking Store.
After the corrected log-ratios, Mij (where i indexes the slides and j the probes), have been obtained, the analysis of the differences between targets is performed using this menu. This uses analysis of variance (ANOVA) with a pooled error across treatments/targets for each probe. The normalization of each slide effectively removes the block effects, so the Mij values now reflect the differences between treatments on each slide and there is one measurement per slide rather than two. Thus the design matrix, X, for the ANOVA is not standard. If the t target effects are given by T = [T1, T2, … Tt], then the model in matrix notation is:

The constant term μ estimates the dye swap effect for the probe. The usual restriction on T is required to obtain estimates, as one parameter is redundant. If we impose the restriction, then we have the usual least squares solution:

where X1 = [1…1]’ and 
where R is the (t+1) vector [0, 1…] that applies the restriction above.
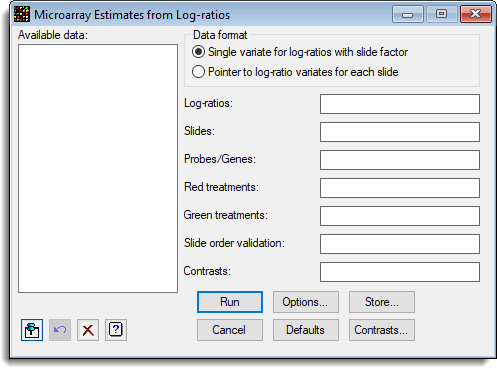
Available data
This lists data structures appropriate for the field which currently has focus. You can double-click a name to enter it in the currently selected field or type the name.
Data format
The data can be supplied in either of the following formats:
- Single variate for log-ratios with slide factor – All the log-ratios are stacked into a single variate, with factors that index the slide and probe/gene
- Pointer to log-ratio variates for each slide – Each slide has its data in a variate, and a pointer which points to this set of variates is provided. The Slides factor is not required, but if supplied it should just have one entry for each slide in the order of the variates in the pointer. The Probes/genes factor is that for a single slide, and all slides must have a common layout.
The spreadsheet stack and unstack menus can be used to reorganise the data between these two formats.
Log-ratios
A variate containing the log-ratios to be analysed, or a pointer to a set of variates for each slide. The variates must all contain the data in the same order.
Slides
The factor that identifies the slides. If the data are in pointer format, then this factor should contain just one entry per slide. If the data are in variate (stacked) format, then this factor indexes the slides in the log-ratio variate.
Probes/genes
The factor that identifies the probes or genes. If the data are in pointer format, this factor should contain just the information for a single slide, and all the slides log-ratios are expected in this common order. If the data are in variate (stacked) format, this factor indexes the probes in the log-ratio variate.
Red treatments
A factor containing the target assigned to the red/Cy5 dye. This is assumed to be the channel on the top of the log-ratios. This factor must have the same number of values as levels in the Slides factor.
Note: Cy5 is the technical name for the red fluorescent dye.
Green treatments
A factor containing the target assigned to the green/Cy3 dye. This is assumed to be the channel on the bottom of the log-ratios. This factor must have the same number of values as levels in the Slides factor.
Note: Cy3 is the technical name for the green fluorescent dye.
Slide order validation
A factor the same length as the Red treatments factor which indexes the slides. This must have the same levels/labels as the Slides factor, and is used to verify that the treatments are in the same order as the data specified in the log-ratios. Supplying this factor is optional, but highly recommended to validate whether the data and treatments match as expected. If the labels of the slides and check factor match, but are in a different order, the treatment factors will be sorted into the correct order with a warning.
Contrasts
The optional name of a matrix specifying the contrasts to be estimated. The contrasts matrix must contain a column for each treatment/target and the sum of the rows should equal zero. To create a new contrasts matrix, use the Contrasts button.
Action buttons
| Run | Run the analysis. |
| Cancel | Close the dialog without further changes. |
| Options | Opens a dialog where additional options and settings can be specified for the analysis. |
| Defaults | Reset options to their default settings. Clicking the right mouse on this button produces a pop-up menu where you can choose to set the menu using the currently stored defaults or the Genstat default settings. |
| Store | Opens a dialog to specify names of structures to store the results from the analysis. The names to save the structures must be supplied before running the analysis. |
| Contrasts | Creates a contrasts matrix. If either the Contrasts or Red treatments fields are blank then you will be prompted to supply the names for these. After the names of the contrast matrix and red treatments factor have been supplied you will be prompted for the number of contrasts, and then a spreadsheet will be created where you can enter the names and values for the contrasts. |
Action Icons
| Pin | Controls whether to keep the dialog open when you click Run. When the pin is down |
|
| Restore | Restore names into edit fields and default settings. | |
| Clear | Clear all fields and list boxes. | |
| Help | Open the Help topic for this dialog. |
Example
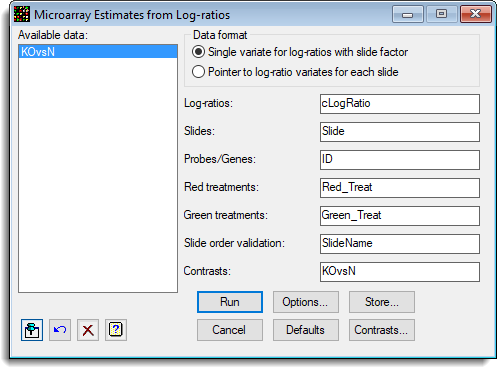
The following shows the estimated effects from a mouse knock out experiment (ApoAIKnockOutSlides.gsh). The corrected log-ratios from the normalize two channel microarray data menu have been saved in cLogRatio. A spreadsheet containing the structure of the experiment has been set up:
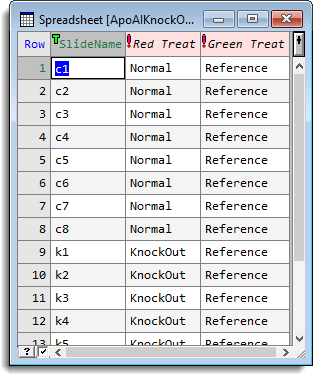
The trial contains 16 slides, with 8 knock mice and 8 normal (Control) mice compared with a standard reference (ApoAIKnockOutStacked.gsh). The options to estimate the effects are set up as follows:
Note that the column SlideName is set up to check that the order of the labels in the factor Slide is the same as the order of the slides in this spreadsheet.
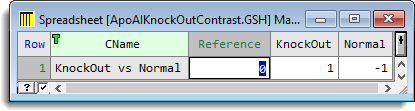
A contrast matrix has been set up which provides the comparison between the knock out and control mice (ApoAIKnockOutContrast.gsh). To create this spreadsheet you can use the Contrasts button, and specify a single contrast. However as there are no dye swaps in this experiment, the Red Treatments factor does not contain all the treatment labels, so that you will need to add a column to the created matrix. The row name and label have also been edited to change these from the default values, and the 1 and -1 have been entered for the Knock Out and Normal groups giving the contrast Knockout – Control.
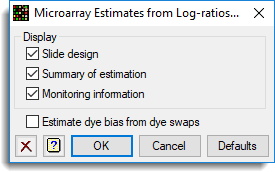
The options for this are set with the Options dialog shown below. Note that as there are no dye swaps the Estimate dye bias from dye swaps option can not be used.
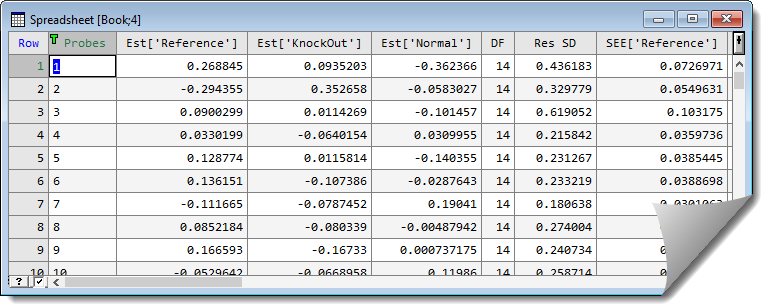
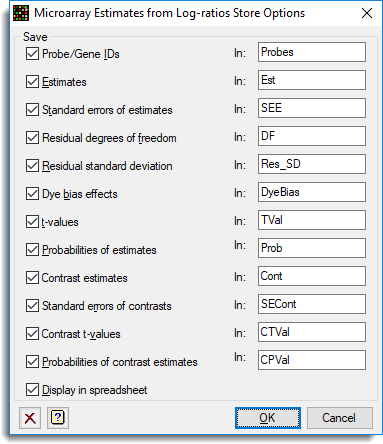
The Store dialog is used to save all the results to a spreadsheet:
This results in the following spreadsheet being produced: