Select menu: Stats | Microarrays | Analyse | One Channel ANOVA
Use this to estimate effects using a separate Analysis of Variance for each probe from the between slide/chip differences. The expression values are obtained either by reading a series of Affymetrix CHP files and the chip information from a CDF file, or by processing a series of CEL files using the Calculate Affymetrix Expression Values menu. Before running this analysis the expressions can be further normalized using the One Channel Quantile Normalization menu.
- After you have imported your data, from the menu select
Stats | Microarrays | Analyse | One Channel ANOVA. - Fill in the fields as required then click Run.
You can set additional Options before running and store the results by clicking Store.
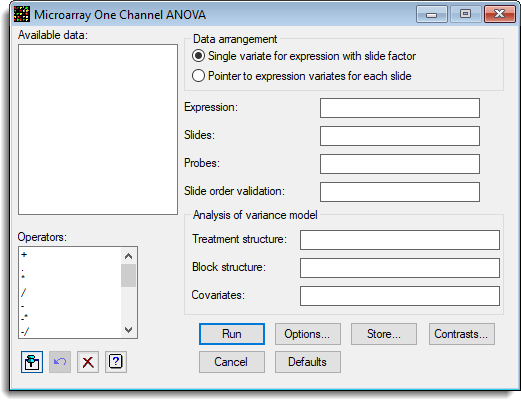
The analysis for the menu is performed using the MAANOVA procedure which performs an analysis of variance to analyse the expression values for each probe. The Parallel ANOVA menu is a more general form of this menu.
Available data
This lists data structures appropriate for the field which currently has focus. You can double-click a name to enter it in the currently selected field or type the name.
Data arrangement
The data can be supplied in either of the following formats:
- Single variate for expression with slide factor – All the log-ratios are stacked into a single variate, with factors that index the slide and probe/gene
- Pointer to expression variates for each slide – Each slide has its data in a variate, and a pointer which points to this set of variates is provided. The Slides factor is not required, but if supplied it should just have one entry for each slide in the order of the variates in the pointer. The Probes/Genes factor is that for a single slide, and all slides must have a common layout.
Use the spreadsheet stack and unstack menus reorganise the data between these two formats.
Expression
A variate containing the expressions to be analysed, or a pointer to a set of variates containing the expressions for each slide. The variates must all contain the data in the same order.
Slides
The factor that identifies the slides. If the data are within pointer format, then this should have just one entry per slide. If the data are within variate (stacked) format, then this factor indexes the slides in the log-ratio variate.
Probes
The factor that identifies the probes or genes. If the data are within pointer format, then this should contain the information for a single slide, and all the slides log-ratios are expected in this common order. If the data are in variate (stacked) format, then this factor indexes the probes in the expression variate.
Slide order validation
A factor the same length as the factors within the Treatment structure which indexes the slides. This must have the same levels/labels as the Slides factor, and is used to verify that the treatments are in the same order as the data specified in the expressions. Supplying this factor is optional, but highly recommended to validate whether the data and treatments match as expected. If the labels of the slides and check factor match, but are in a different order, the treatment factors will be sorted into the correct order with a warning.
Treatment structure
A formula specifying the combinations of factors that describes the treatment structure for the series of slides. For a single factor experiment this will just be the name of the factor that specifies the targets used on each slide.
Block structure
A formula specifying the combinations of factors that describes the block structure for the series of slides. If the slides have not been processed in replicates, i.e. are completely randomized, then this field should be left blank.
Covariates
Lets you supply a list of variates to use as covariates in an analysis of covariance. If there are several covariates their names can be separated by spaces or commas.
Operators
This provides a quick way of entering operators in the treatment and block model formulas. Double-click on the required symbol to copy it to the current input field. You can also type in operators directly. See model formula for a description of each operator.
Action buttons
| Run | Run the analysis. |
| Cancel | Close the dialog without further changes. |
| Options | Opens a dialog where additional options and settings can be specified for the analysis. |
| Defaults | Reset options to their default settings. Clicking the right mouse on this button produces a pop-up menu where you can choose to set the options using the currently stored defaults or the Genstat default settings. |
| Store | Opens a window to specify names of structures to store the results from the analysis. The names to save the structures must be supplied before running the analysis. |
| Contrasts | Opens a contrasts dialog where you can create a new contrasts matrix. Within this dialog you need to specify the number of contrasts and type of contrast (regression or comparison contrasts) which will then create a matrix spreadsheet where you can enter the names and values of the contrasts. |
Action Icons
| Pin | Controls whether to keep the dialog open when you click Run. When the pin is down |
|
| Restore | Restore names into edit fields and default settings. | |
| Clear | Clear all fields and list boxes. | |
| Help | Open the Help topic for this dialog. |
See also
- One Channel ANOVA Options
- One Channel ANOVA Store Options
- One Channel Regression
- Microarray Menus
- One Channel Quantile Normalization menu
- Calculate Affymetrix Expression Values menu
- Robust Means Analysis menu
- One channel Quantile Normalization menu
- Parallel ANOVA menu
- Microarray procedures
- MAANOVA procedure
- ANOVA directive