Select menu: Stats | Microarrays | Calculate | Affymetrix Expression Values
Use this to estimate the expression values over the pairs of perfect match/mismatches for each probe on the slides/chips. On Affymetrix chips, each probe has 8-20 pairs of DNA sequences with a central base changed between the perfect match and mismatch sequences. The value for the probe level of expression is taken as an average over the pairs of perfect match (PM) and mismatch (MM) spots.
The intensity values are obtained by reading in a series of Affymetrix CEL files, and the chip information from a CDF file. The size of data handled from CEL files can be very large, so it can be advantageous to use the options for batch processing the files when they are opened.
- After you have imported your data, from the menu select
Stats | Microarrays | Calculate | Affymetrix Expression Values. - Fill in the fields as required then click Run.
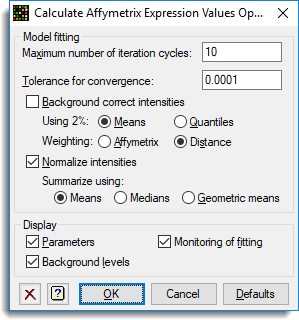
You can set additional Options before running the analysis by clicking Options.
Available data
This lists data structures appropriate for the field which currently has focus. Double-click a name to move it into the currently selected field or type the name directly.
Method
The statistical method used to summarize over the PM/MM pairs. The methods available are:
| RMA – Robust means analysis model | The probe level model introduced by Irizarry et al. (2003) which only uses PM information and transforms the values based on a kernel density estimate of the PM distribution |
| RMA2 – Robust means analysis 2 | An adaptation of RMA algorithm which fits the kernel density to a truncated distribution of the PM values, with the truncation point based on an initial kernel density estimate. |
| MAS4 – Affymetrix version 4 | The AvDiff algorithm introduced in the Affymetrix version 4 software |
| MAS5 – Affymetrix version 5 | The Tukey biweight algorithm introduced in the Affymetrix version 5 software |
In the Affymetrix MAS 4 and 5 methods the difference between the signals, PM – MM is averaged using a robust averaging. The MAS 4 algorithm uses the AvDiff algorithm which discards the minimum and maximum difference, and any differences greater than 3 standard deviations from the mean. The MAS 5 algorithm uses the Tukey biweight algorithm which reweights the differences depending on how far they are from the median, and discards any differences which are more than 5 times the median absolute distance from the median. The MAS 5 algorithm also replaces the MM value with a value which is always less than the PM value, calculating what is known as an Ideal mismatch (IM) in this situation.
The standard RMA algorithm would normally use the log 2 transformed PM values with no background correction, which then have a quantile normalization applied to them. The adjusted PM values then have a normal function transformation applied to them with the values for the transformation being calculated from a kernel density estimate applied to the adjusted PM values. Finally the transformed PM values are summarised with a median polish of the slides by atom values for each probe.
The RMA model performs a background correction by fitting a two component model to the PM intensities, where the model is:
Observed Intensity = Signal + Noise
where Signal has an Exponential distribution with parameter alpha (the reciprocal of the mean), the Noise has a Normal distribution with parameters mu (the mean), and sigma (the standard deviation). Alpha, mu and sigma are then estimated and the expected value of the signal is estimated, given the observed value of the intensity.
Data arrangement
The data can be supplied in either of the following formats:
- Single variate for expression with slide factor – All the log-ratios are stacked into a single variate, with factors that index the slide and probe/gene
- Pointer to expression variates for each slide – Each slide has its data in a variate, and a pointer which points to this set of variates is provided. The Slides factor is not required, but if supplied it should just have one entry for each slide in the order of the variates in the pointer. The Probes/Genes factor is that for a single slide, and all slides must have a common layout.
The spreadsheet stack and unstack menus can be used to reorganise the data between these two formats.
Intensity
A variate containing the intensities to be analysed.
Use log (base 2) transformation of intensities
The Intensity variate is log 2 transformed before the analysis. The calculation for the transformation using Genstat command language is:
CALC LogY = LOG(Y)/LOG(2)
Slides
The factor that identifies the slides or chips.
Probes
The factor that identifies the probes or genes within each chip
Atoms
A factor which indexes the PM/MM pairs within each probe.
Type
A factor specifying the probe types. The Affymetrix chips use quality control probes, but these are not summarized and are discarded from the analysis. The types of probes that can occur on Affymetrix chips are:
- Expression
- Genotyping
- CustomSeq
- Tag
- Unknown
- Checkerboard Negative
- Checkerboard Positive
- Hybridization Negative
- Hybridization Positive
- Text Negative
- Text Positive
- Central Negative
- Central Positive
- Gene Exp Negative
- Gene Exp Positive
- Cycle Fidelity Negative
- Cycle Fidelity Positive
- Central Cross Negative
- Central Cross Positive
- Cross Hyb Negative
- Cross Hyb Positive
Slide rows
A factor specifying the row on the slide of each intensity. This is only required if the Background Correction option is selected in the Calculate Affymetrix Expression Values Options menu.
Slide columns
A factor specifying the column on the slide of each intensity. This is only required if the Background Correction option is selected in the Calculate Affymetrix Expression Values Options menu.
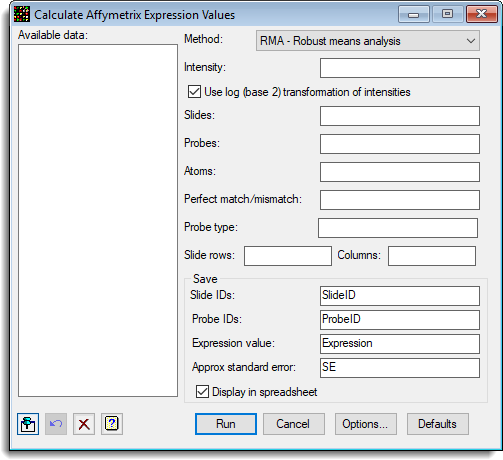
Save
This section allows the structure to contain the results to be set. The Slide IDs, Probe IDs and Expression fields must be set, whilst saving the Approx standard error results is optional.
| Slide IDs | Factor | Indexes the slides in the resulting Expression variate |
| Probe IDs | Factor | Indexes the probes in the resulting Expression variate |
| Expression | Variate | Stores the average expression for each slide and probe combination |
| Approx standard error | Variate | Approximate standard errors for the expressions for each slide and probe combination. Saving this standard error involves many calculations and can slow down the time taken to run the analysis. |
Display in Spreadsheet
Select this to display the results in a spreadsheet.
Action buttons
| Run | Run the analysis. |
| Cancel | Close the dialog without further changes. |
| Options | Opens a dialog where additional options and settings can be specified for the analysis. |
| Defaults | Reset the default settings. Clicking the right mouse on this button produces a popup menu where you can choose to set the menu using the currently stored defaults or the Genstat default settings. |
Action Icons
| Pin | Controls whether to keep the dialog open when you click Run. When the pin is down |
|
| Restore | Restore names into edit fields and default settings. | |
| Clear | Clear all fields and list boxes. | |
| Help | Open the Help topic for this dialog. |
References
Example
The following shows the menu set up to calculate the expression values for the 9 slides.

The options were set as follows:
See also
- Calculate Affymetrix Expression Values Options
- Microarray menus
- One channel Quantile Normalization
- One channel ANOVA
- Robust Means Analysis
- Two channel microarray example for analysing two channel microarray data
- Microarray procedures
- AFFYMETRIX procedure