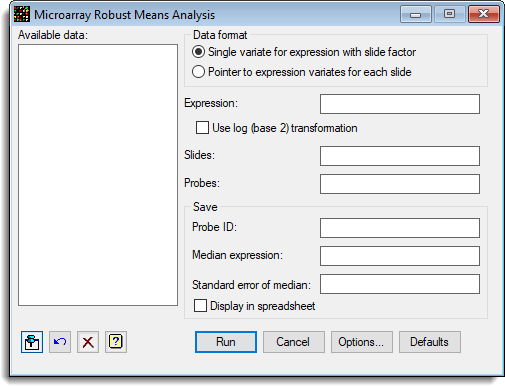
Select menu: Stats | Microarrays | Analyse | Robust Means Analysis
Use this to calculate the medians of probe expression values across a series of slides. The median expression level for each slide is estimated and removed in a iterative fashion using an algorithm called the median polish algorithm. An approximate standard error of the mean can be calculated, which is defined as 1.483 times the median absolute deviation from the probes median.
- After you have imported your data, from the menu select
Stats | Microarrays | Analyse | Robust Means Analysis. - Fill in the fields as required then click Run.
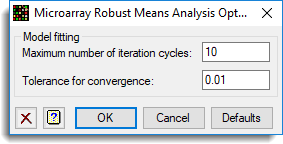
You can set additional Options before running the analysis.
Available data
This lists data structures appropriate for the field which currently has focus. You can double-click a name to enter it in the currently selected field or type the name.
Data arrangement
The data can be supplied in either of the following formats:
- Single variate for expression with slide factor – All the log-ratios are stacked into a single variate, with factors that index the slide and probe/gene
- Pointer to expression variates for each slide – Each slide has its data in a variate, and a pointer which points to this set of variates is provided. The Slides factor is not required, but if given should just have one entry for each slide in the order of the variates in the pointer. The Probes/Genes factor is that for a single slide, and all slides must have a common layout.
The spreadsheet stack and unstack menus can be used to reorganise the data between these two formats.
Expression
The expression values to summarize.
Use log (base 2) transformation
The Expression variate is log 2 transformed before summarizing it. The calculation for this using Genstat’s command language is:
CALC LogY = LOG(Y)/LOG(2)
Slides
The factor that identifies the slides. If the data are in a pointer format, then this has just one entry per slide. However, if the data are in a variate (stacked) format, this factor indexes the slides in the intensity variate. This item is not required when a pointer is specified.
Probes
The factor that identifies the probes or genes on a slide. If the data are in pointer format, this has just one entry per probe, but if the data are in variate (stacked) format, this factor indexes the probes in the expression variate.
Save
These items specify the data to be saved from the analysis.
| Probe IDs | Text | The probe labels to index the results. |
| Median expression | Variate | The median expression level for each probe. |
| Standard error of median | Variate | The approximate standard error of the median expression level for each probe. |
Display in spreadsheet
If this is selected, the saved results will also be displayed within spreadsheet windows.
Action buttons
| Run | Run the analysis. |
| Cancel | Close the dialog without further changes. |
| Options | Opens a dialog where additional options and settings can be specified for the analysis. |
| Defaults | Reset options to their default settings. Clicking the right mouse on this button produces a shortcut menu where you can choose to set the options using the currently stored defaults or the Genstat default settings. |
Action Icons
| Pin | Controls whether to keep the dialog open when you click Run. When the pin is down |
|
| Restore | Restore names into edit fields and default settings. | |
| Clear | Clear all fields and list boxes. | |
| Help | Open the Help topic for this dialog. |
Example
A set of results from 9 Affymetrix chips is to be summarized (Hyb-Expressions.gsh). The expression values have been created with the Calculate Affymetrix Expression Values menu. These are now to be summarized for each probe with the following menu:
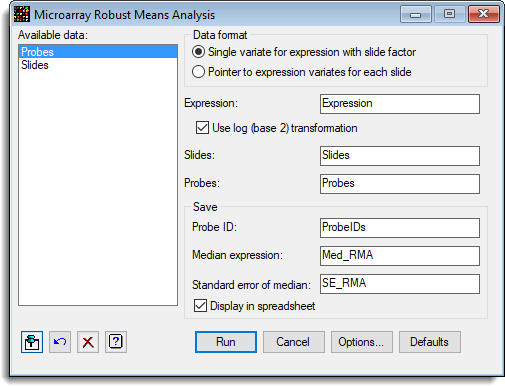
The options used were set in the Options dialog:
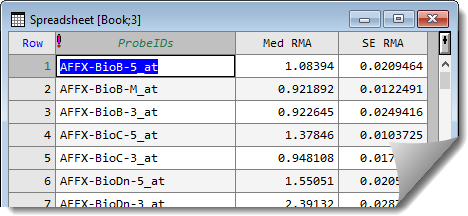
This gives a spreadsheet containing the results:
See also
- Robust Means Analysis Options
- Microarray Menus
- One Channel Quantile Normalization
- Calculate Affymetrix Expression Values
- One Channel ANOVA
- Histograms, density plots, spatial plots and 2D plots for visualizing microarray data
- Microarray Procedures
- MAROBUSTMEANS procedure