Select menu: Stats | Microarrays | Analyse | Empirical Bayes Error Estimation
In a microarray experiment, as hundreds and often thousands of probes are being processed in parallel there is a loss of power if you consider the variation of each probe in isolation. If this parallelism is used between the genes to gain extra information on the variation of an individual probe, then more powerful tests of the level of differential expression of a probe can be obtained. To do this, a prior distribution of the standard deviations is assumed or equivalently the variances over the probes. In this approach it is assumed that the reciprocal of the variance is distributed with a multiple of a chi-square distribution with d0 degrees of freedom, i.e.
1/sp2 ~ 1/(d0s02) ![]() d0. (Equation 1)
d0. (Equation 1)
If the parameters of this distribution, the prior degrees of freedom and standard deviation, d0 and s0 are estimated, more information can be gained on an individual probe by shrinking it towards the prior, depending on the amount of information in the standard deviation of an individual probe, sp, (in this case its degrees of freedom, dp). The modified standard deviation s~p is then given by:
 (Equation 2).
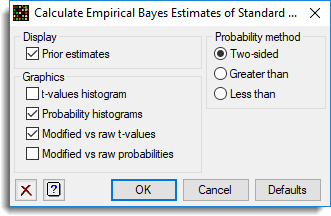
A modified t-test can then be performed using the modified standard deviation with d0 + dp degrees of freedom. The method can also produce the two-sided p values from a test of the differential expression being different from 0.
- After you have imported your data, from the menu select
Stats | Microarrays | Analyse | Empirical Bayes Error Estimation. - Fill in the fields as required then click Run.
You can set additional Options before running the analysis.
Available data
This lists data structures appropriate to the current input field. Double-click a name to copy it to the current input field or type the name..
Data type
The data can be supplied in either of the following formats:
| Means | A variate containing means for each probe. These are normally the estimates of differential expression for the effect or a contrast from the trial. |
| t-values | A variate containing the t-values for each probe, i.e. an effect or contrast divided by its standard error. |
| Pointer | A pointer to the columns of data, one variate per slide, with the probes in the same position within each variate. The means and standard deviations will be calculated from the raw data. |
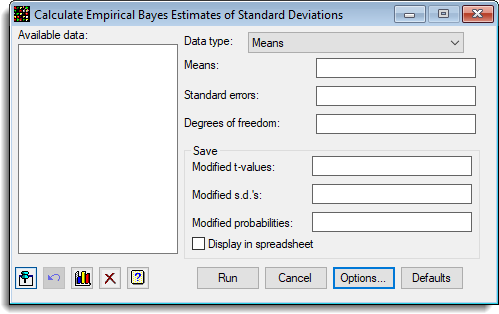
Means/t-values/pointer
Specifies the data for the analysis. The label displayed and required data structure type for this option depends on the current selection in the Data type list.
Standard deviations
The standard deviations for each probe when the data are supplied as means or t-values.
Degrees of freedom
The degrees of freedom when the data are supplied as means or t-values.
Save
Lets you save results from the analysis. Type the names for the identifiers of the data structures into the corresponding fields.
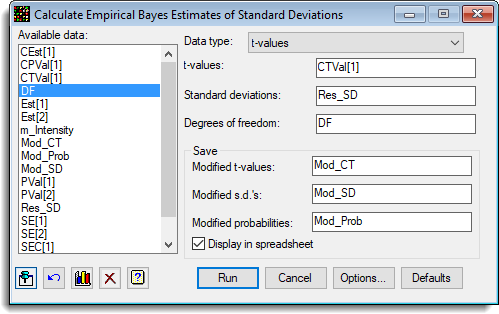
| Modified t-values | Variate | The adjusted t -values, using the modified standard deviations calculated as below |
| Modified SDs | Variate | The modified standard deviations for each probe as specified in equation 2. Note that the values for d0 and s0 can be displayed in the Output window, if the options to display these are selected. |
| Modified probabilities | Variate | The modified probabilities of the t-values being significantly different from zero when the true mean is 0. This is a two sided probability, for example using the Genstat command language, CALC Mod_Pr = 2*CLT(ABS(T);D0+DG) |
Display in spreadsheet
When selected, the saved results will also be displayed within spreadsheet windows. If a spreadsheet containing the Probability variate is currently open within Genstat, the saved results will be added to this spreadsheet.
Action buttons
| Run | Run the analysis. |
| Cancel | Close the dialog without further changes. |
| Options | Opens a dialog where additional options and settings can be specified for the analysis. |
| Defaults | Reset options to their default settings. Clicking the right mouse on this button produces a shortcut menu where you can choose to set the options using the currently stored defaults or the Genstat default settings. |
Action Icons
| Pin | Controls whether to keep the dialog open when you click Run. When the pin is up |
|
| Restore | Restore names into edit fields and default settings. | |
| Graphics Output | Controls how graphs are to be drawn. You can either draw the graph in the Graphics View or save direct to files (JPEG, TIFF, EPS, EMF, GMF, BMP or PNG). | |
| Clear | Clear all fields and list boxes. | |
| Help | Open the Help topic for this dialog. |
Example
The following image shows the estimation of the modified t-values and probabilities for the differential expression in a knock out mouse experiment (Estimates13-6-9.gsh). The dialog to do this analysis is shown below:
The options controlling the output and plots is:
This produces the output:
Empirical Bayes estimation of modified t-values
	Data	                     CTVal[1](variate of t-values)
	Number of tests	                 3519
	Mean standard deviation	         0.2437
	Median standard deviation	 0.2082
	Median degrees of freedom	 3.000
	Prior standard deviation	 0.2122
	Prior degrees of freedom	 3.995
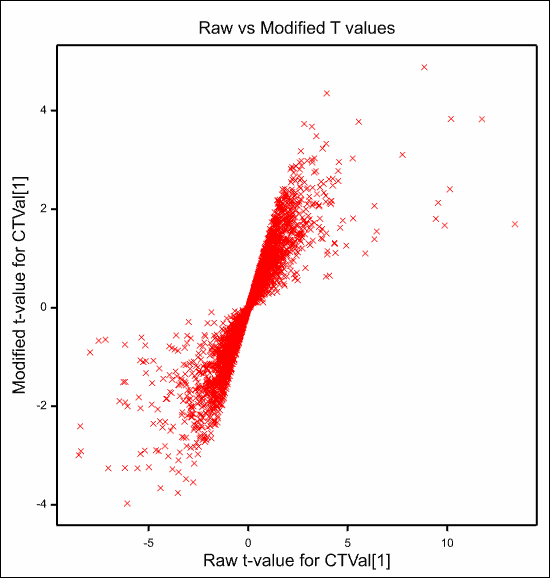
This produces the plot of the modified p-values vs the raw p-values:
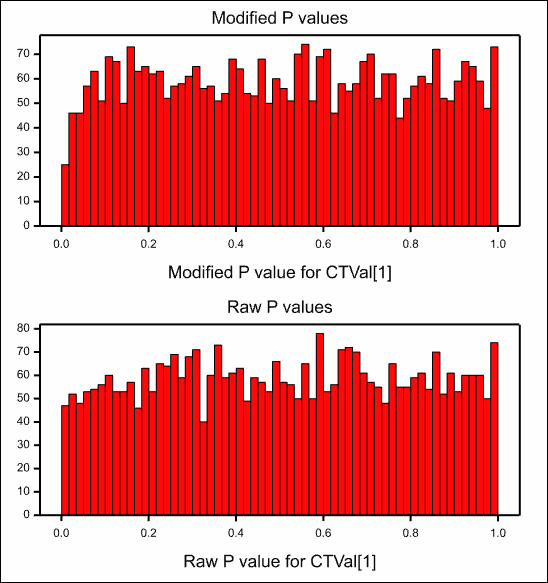
and the plot of the modified versus the raw t-values which shows a very strong linear relationship between the two as the degrees of freedom only range between 11 and 14.
See also
- Empirical Bays Estimates Options
- Microarray Menus
- Histograms, density plots, spatial plots and 2D plots for visualizing microarray data
- Microarray Procedures
- MAEBAYES procedure
- One Channel ANOVA
- One Channel Regression
- Estimates from Log-ratios