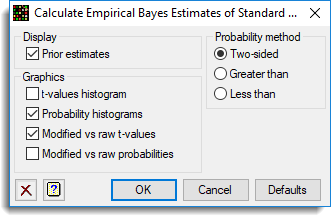
Use this to to specify options for an empirical Bayes error estimation analysis.

Display prior estimates
Display the estimates of the prior parameters, d0 and s0, in the Output window.
Probability method
This lets you choose the type of t-test to use for the probabilities:
| Two-sided | The probability is calculated as P(-|T| <= t <= |T|) |
| Greater than | The probability is calculated as P(t >= T) |
| Less than | The probability is calculated as P(t <= T) |
Graphics
Controls which graphics are to be displayed with the analysis:
| t-values histogram | Two histograms showing the modified and raw t-values plotted on the same scale. |
| Probability histogram | Two histograms showing the modified and raw probabilities plotted on the same scale. |
| Modified vs raw t-values | A scatter plot of modified t-values versus raw t-values. |
| Modified vs raw probabilities | A scatter plot of modified probabilities versus raw probabilities. |
Action buttons
| OK | Save the options settings and close the dialog. |
| Cancel | Close the dialog without making any changes. |
| Defaults | Reset options to their default settings. |
Action Icons
| Clear | Clear all fields and list boxes. | |
| Help | Open the Help topic for this dialog. |
See also
- Empirical Bayes Error Estimation menu
- MAEBAYES procedure