(This option is available on some dialogs, such as Histograms of Microarray Data available from the Stats | Microarrays | Explore menu).
Use this to control how graphs are produced from running an analysis. You can choose to display graphs within the Genstat Graphics Viewer or draw the graphs directly into files.
- At the bottom left of the parent dialog click
 to open the Graphics dialog below.
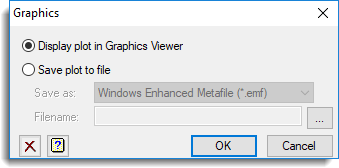
Display plot in Graphics Viewer
When selected, graphs are displayed within the Genstat Graphics Viewer.
Save plot to file
When selected, graphs are saved directly into files. You can choose to save a graph in one of the following formats:
| Encapsulated Postscript (*.eps) |
| Windows Enhanced Metafile (*.emf) |
| JPEG files (*.jpg, *.jpeg) |
| TIFF files (*.tif, *.tiff) |
| Portable Network Graphics File (*.png) |
| Genstat Metafile (*.gmf) |
| Windows Bitmap file (*.bmp) |
Specify the name and path of the file to be saved in the space provided. Alternatively, you can locate a file by clicking on the ![]() button.
button.