Select menu: Stats | Microarrays | Analyse | False Discovery Rate
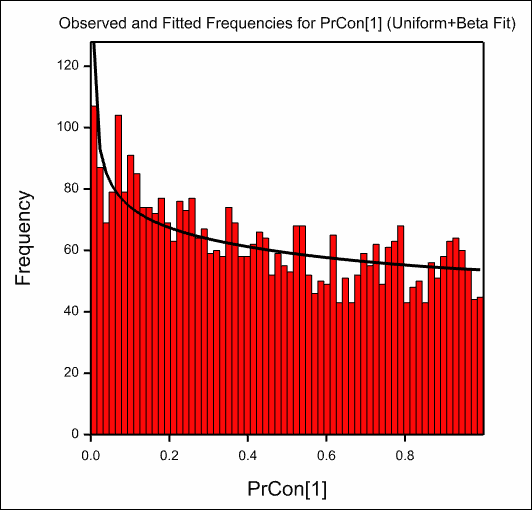
Use this to fit a mixture model to a distribution of probabilities. The two components of the mixture can be thought as those probes which are showing differential expression (the Beta/Gamma component) and those not responding (the Uniform component) whose probabilities values then form a random sample from the null distribution of the test statistic.
- After you have imported your data, from the menu select
Stats | Microarrays | Analyse | False Discovery Rate by Mixture. - Fill in the fields as required then click Run.
You can set additional Options before running and store the results by clicking Store.
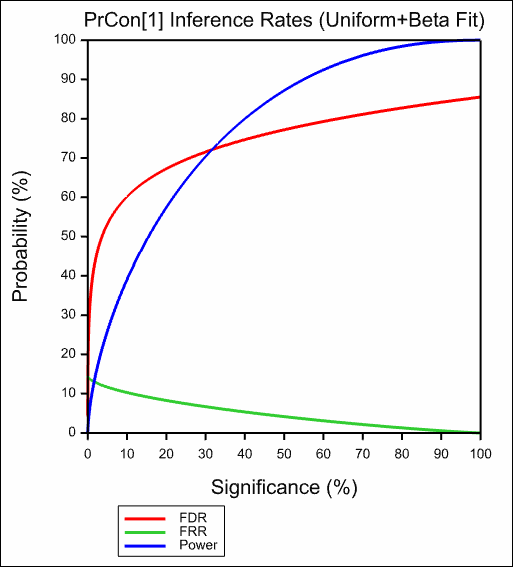
The false discovery rate (FDR), false rejection rate (FRR) and power of a test by modelling significance values as a 2-component mixture of Uniform and Beta or Gamma densities, Allison et al. (2002) are estimated. The context is multiple testing, with data from any situation where the same simple hypothesis, Ho, is tested many times, such as in transcriptomics (microarrays), metabolomics and proteomics. These tests generate a large number of significance values which, under H0, have a Uniform distribution and, under Ha, can be modelled as a Beta or truncated Gamma density. The parameters of this mixture distribution to derive the False Discovery Rate, Prob(H0/Da), the False Rejection Rate, Prob(Ha/D0) and the Power of the test, Prob(Da/Ha), each as a function of pcrit are estimated. Here Da denotes the event “p<pcrit”.
The mixture model parameterization takes a proportion P from the Uniform distribution, and (1 – P) from either a Beta or Gamma distribution. The Gamma parameterization is:
f(x) = (1/b)A / Gamma(A) × exp(-x/B) × x(A-1), truncated at x=1,
and the Beta parameterization is:
f(x) = x(A-1) × (1-x)(B-1) / Beta(A; B).
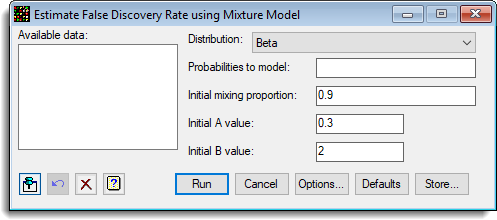
A range of graphs are plotted after the mixture model has been fitted. Initial values for the 3 parameters P,A and B need to be provided.
Available data
This lists data structures appropriate for the field which currently has focus. You can double-click a name to enter it in the currently selected field or type the name.
Distribution
The distribution for the responding probes to mix with the uniform distribution, either:
| Beta | The Beta distribution |
| Truncated gamma | The Gamma distribution truncated at 1. |
These distributions are described above.
Probabilities to model
This variate contains the probabilities to which the mixture distribution is fitted. All the values in the variate should be between 0 and 1 (although missing values (*) are allowed).
Initial mixing proportion
The initial value for proportion of the sample which are from the Uniform distribution, i.e. those probes which are not showing any differential expression, but whose effects are caused by random measurement errors. The iterations will start at this value and try and find optimal parameters. If this is a long way from the optima, then the optimization iterations may not converge.
Initial A value
The initial value of A parameter for the Beta or Truncated Gamma distribution. The iterations will start at this value and try and find optimal parameters. If this is a long way from the optima, then the optimization iterations may not converge.
Initial B value
The initial B parameter for the Beta or Truncated Gamma distribution. The iterations will start at this value and try and find optimal parameters. If this is a long way from the optima, then the optimization iterations may not converge.
Action buttons
| Run | Run the analysis. |
| Cancel | Close the dialog without further changes. |
| Options | Opens a dialog where additional options and settings can be specified for the analysis. |
| Defaults | Reset the options back to their default settings. Clicking the right mouse on this button produces a pop-up menu where you can choose to set the options using the currently stored defaults or the Genstat default settings. |
| Store | Opens a dialog to specify names of structures to store the results from the analysis. The names to save the structures must be supplied before running the analysis. |
Action Icons
| Pin | Controls whether to keep the dialog open when you click Run. When the pin is down |
|
| Restore | Restore names into edit fields and default settings. | |
| Clear | Clear all fields and list boxes. | |
| Help | Open the Help topic for this dialog. |
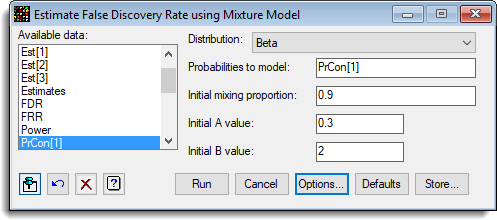
Example
The following menu shows the fitting of a mixture model to the probabilities from a microarray experiment (ApoAIKnockOutEffects.GSH):
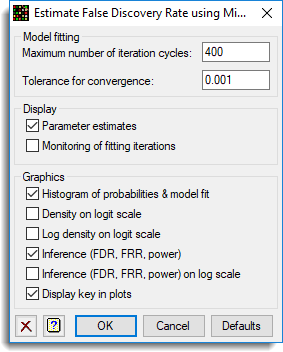
The options used were:
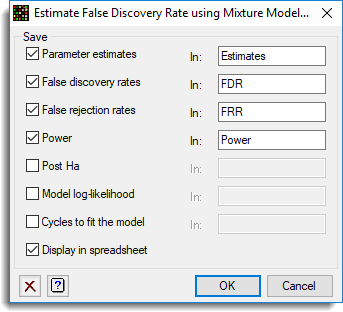
and the Store button was used to save results back to a spreadsheet:
The resulting graphs are show below:
See also
- False Discovery Rate using Mixture Model Options
- False Discovery Rate using Mixture Model Store Options
- FDRMIXTURE procedure
- False Discovery Rate using Bonferroni
- FDRBONFERRONI procedure
- Two Channel Microarray Example
- Normalize 2 Channel Microarray
- Calculate Microarray Log-Ratios
- Microarray Menus
- Two Channel Microarray Design
- Open Microarray Data Files
- Histograms
- Spatial Plot
- Density Plot
- 2D Plots
- Normalize 2 Channel Microarray
- Estimates from Log-Ratios
- Empirical Bayes Estimates
- Volcano Plot
- Cluster Probes/Genes
- Cluster Targets/Slides
- Two-way Clustering
- Calculate Affymetrix Expression Values
- One channel Quantile Normalization
- One Channel ANOVA
- Robust Means Analysis