Use this to set the options for the False Discovery Rate using Mixture Model menu.
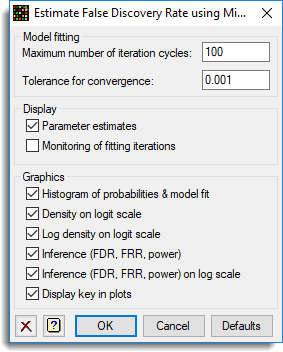
Model fitting
Parameters which control the model fitting algorithm
| Maximum number of Iteration cycles | The maximum number of iterations of estimating the model parameters. If the model has not converged before this number of iterations the FDRMIXTURE procedure will exit with a warning. Increase this parameter to force more iterations. Changing the initial parameters may help decrease the number of iterations to convergence. Using the final parameter estimates as the initial settings on another run should increase the probability of convergence. |
| Tolerance for convergence | When all changes in current estimates of P, A, & B between iterations are smaller than this value, then the model fitting is deemed to have converged. If this value is too low, the model will take a long time to converge and the iterations will exceed the Maximum number of iteration cycles. If this value is too large, the parameters of the model may still not be close to the optimum estimates when the model has deemed to have converged. |
Display
Specifies which items of output are to be produced.
| Parameter estimates | The estimates of the P, A and B parameters in the mixture model |
| Monitoring of fitting iterations | The current estimates of P, A, & B and log-likelihood and changes in these on each iteration of the model fitting |
Graphics
Specifies which graphs are to be produced.
| Histogram of probabilities & model fit | The plot of the fitted mixture against the histogram of probabilities |
| Density on logit scale | The fitted mixture against the kernel density estimate of the probabilities on a logit scale (this allows a more detailed comparison at small probability value). |
| Log density on logit scale | As above, but gives even greater detail, by putting the density on a log scale (note that greater variation is expected around small density values on the log scale). |
| Inference (FDR, FRR, power) | The plot of FDR, FRR and power against p |
| Inference (FDR, FRR, power) on log scale | Plots these statistics on log scales, with the X-axis restricted to probabilities < 0.5, with a background grid, to enable estimates to be read for specific probability values. |
Display key in plots
Display under the inference plots the key to the curves for FDR, FRR and power.
Action buttons
| OK | Save options and close the dialog. |
| Cancel | Close the dialog without further changes. |
| Defaults | Reset options to the default settings. |
Action Icons
| Clear | Clear all fields and list boxes. | |
| Help | Open the Help topic for this dialog. |
See also
- False Discovery Rate using Mixture Model
- False Discovery Rate using Mixture Model Store Options
- False Discovery Rate using Bonferroni
- FDRMIXTURE procedure
- FDRBONFERRONI procedure
- Microarray Menus
- Two Channel Microarray Design
- Open Microarray Data Files
- Calculate Microarray Log-Ratios
- Histograms
- Spatial Plot
- 2-D Plots
- Normalize 2 Channel Microarray
- Estimates from Log-Ratios
- Empirical Bayes Estimates
- Volcano Plot
- Cluster Targets/Slides
- Cluster Probes/Genes
- Two-way Clustering