Select menu: Stats | Summary Statistics | Summary of Circular Data
This menu provides facilities for summarizing data values that consist of directional observations recorded as angles between 0 and 360 degrees.
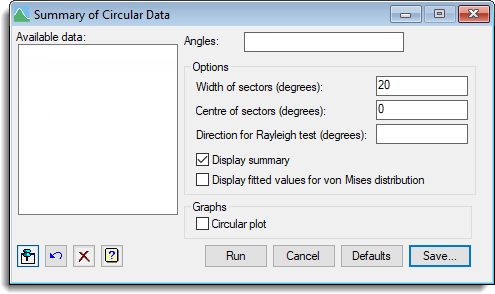
- After you have imported your data, from the menu select
Stats | Summary Statistics | Summary of Circular Data. - Fill in the fields as required then click Run.
After running, you can save the results by clicking Save.
Two tests of uniformity are calculated, a test of randomness and a Rayleigh test of uniformity. The null hypothesis for both of these tests is that the observations come from a uniform distribution around the circle. The tests allocate angles to angular sectors of equal size. The width and centre of the sectors are specified in the options. The midpoints of sectors are calculated by adding a multiple of the specified width to the specified centre. For example, if the width is 20 and the centre is 0 then the sectors will be centred at 0, 0+20, 0+2*20, and so on, and so the sector limits are 350-10, 20-30, 30-50, … 330-350.
A third test of conformity to a von Mises distribution compares the observed distribution with the expected von Mises distribution. The parameters of von Mises distribution are the mean direction and concentration parameter (kappa). Kappa measures the spread on the angles around the mean direction. The mean direction and kappa used for the expected distribution are estimated from the observations by maximum likelihood. The observed and expected values are calculated for the angular sectors explained above.
Available data
This lists variates for specifying the angles that are to be summarized. You can double-click a name to copy it to the current input field or type it in.
Angles
Specify a variate containing the directional observations (in degrees).
Width of sectors (degrees)
Specifies the width of sectors (in degrees) into which to group the angles for calculation of the test of randomness and the chi-square goodness of fit statistic for the von Mises distribution.
Centre of sectors (degrees)
Specifies the centre (in degrees) of the sectors
Direction for Rayleigh test (degrees)
Specify the direction for Rayleigh’s test of uniformity against a unimodel alternative.
Display summary
When selected, the following summary statistics are displayed: number of observations, mean direction, circular standard deviation, mean resultant length, skewness and estimate of the parameter Kappa (which provides the concentration parameter of the von Mises distribution for circular data).
Display fitted values for von Mises distribution
When selected, a table of observed and expected counts for the fit of the von Mises distribution is displayed.
Circular plot
When selected, a circular plot of the data is produced.
Action Icons
| Pin | Controls whether to keep the dialog open when you click Run. When the pin is down |
|
| Restore | Restore names into edit fields and default settings. | |
| Clear | Clear all fields and list boxes. | |
| Help | Open the Help topic for this dialog. |
See also
- Summary of circular data save options to save results
- Circular plot for a graph of directional observations
- CDESCRIBE procedure