Select menu: Stats | Six Sigma | Control Charts for Attributes
This menu plots a range of standard control charts for attributes. The type of charts available include the c or u charts representing numbers of defective items and p or np charts for binomial testing for defective items.
- After you have imported your data, from the menu select
Stats | Six Sigma | Control Charts for Attributes. - Fill in the fields as required then click Run.
You can set additional options by clicking Options.
Available data
This lists data structures appropriate to the current input field. The contents will change as you move from one field to the next. Double-click a name to copy it to the current input field or type in the name.
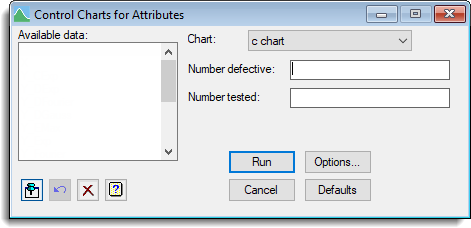
Chart
Specifies the type of control chart.
Number defective
Enter the name of a variate containing the number of defects per batch.
Number tested
Enter a variate identifying the number of items in a batch.
Action Icons
| Pin | Controls whether to keep the dialog open when you click Run. When the pin is down |
|
| Restore | Restore names into edit fields and default settings. | |
| Clear | Clear all fields and list boxes. | |
| Help | Open the Help topic for this dialog. |
See also
- Control Charts for Attributes Options
- Control Charts for Measurements
- SPCCHART procedure for c or u charts
- SPPCHART procedure for n or np charts