Use this to set additional options for the control charts.
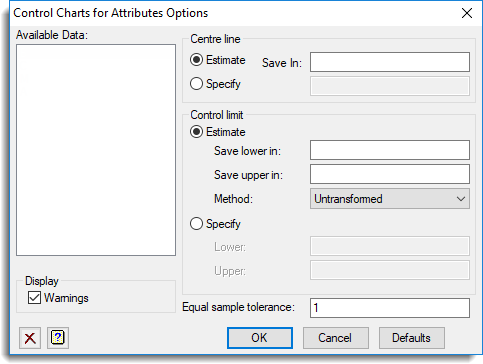
Available data
List scalars that can be used to supply the data. Double-click a name to copy it into the current input field or type the name.
Centre line
Controls whether the centre line is supplied or calculated from the data values. Select Estimate to calculate the centre line from the data values. You can specify a name of a scalar, into the space provided, to save the centre line. Alternatively, select Specify to supply the centre line, entering the value in the space provided.
Control limit
Controls whether the control limit is supplied or estimated from the data values. Select Estimate to estimate the control limits from the data values. You can specify the names of scalars in the spaces provided, to save the upper and lower limits. You can also select the method used to obtain the control limits by selecting an item from the Method list. Alternatively, select Specify to supply the upper and lower control limits, entering the values in the spaces provided.
Display
Specifies the output to be displayed.
| Warnings | Lists any exceedance of the control limits. |
Equal sample tolerance
Specifies a multiplier to use to test whether to use mean sample size for control limits.