Use this to construct a matrix or grid of z-values (heights) suitable for drawing a contour plot, surface plot, 3D histogram or shade plot. You must supply the data as (x,y,z) values; the x and y values can be variates or factors and the z values are a variate. If you supply the x values in a variate, each distinct value (sorted into ascending order) defines a column of the matrix; if you use a factor its levels specify the column index. The y values are interpreted similarly to define the rows of the matrix.
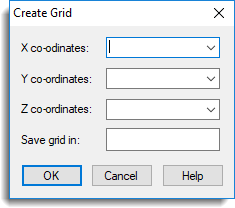
X coordinates and Y coordinates
Specifies variates or factors giving the coordinates or row/column indices of the corresponding Z coordinates. Select the name of the identifier for the coordinates from the list of available variates and factors. Alternatively, type the name of the identifier.
Z coordinates
Specifies the z-values or heights. Select the name of the identifier for the coordinates from the list of available variates and factors. Alternatively, type the name of the identifier.
Save grid in
Specifies a matrix in which to store the grid. Click OK to enter this name in the Data matrix field of the previous dialog.
Notes
If the grid is to be used for a contour or surface plot, or a 3-D histogram, the x and y values must specify the complete grid. That is, for each distinct x value or level the full range of y values must be present in the data. Also, the variate specified for the z values must not contain missing values.