Select menu: Stats | Multivariate Analysis | Principal Components Analysis or Canonical Variates Analysis | Biplot
Use this to produce a biplot of the results from a principal components or canonical variates analysis.
- After you have imported your data, from the menu select
Stats | Multivariate Analysis | Principal Components.
OR
Stats | Multivariate Analysis | Canonical Variates. - After you run the analysis the Biplot button will become enabled. Click to open the dialog below.
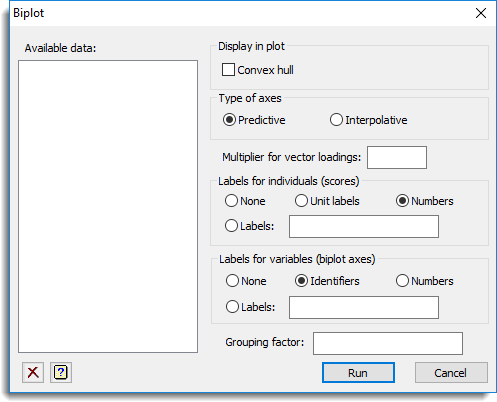
Available data
This lists data structures appropriate to the current input field. It lists texts for use in specifying the labels for the individuals and/or the variables. Double-click a name to copy it to the current input field; alternatively, you can type the name directly into the input field.
Display in plot
Specifies additional items to display in the graph.
| Convex hull | draws a convex hull around the scores. |
| Means | plots the means for each group (canonical variates analysis only). |
Type of axes
Lets you select either predictive or interpolative axes.
Multiplier for vector loadings
Arrows are plotted on the axes to represent their loadings (or inverse loadings); the loadings show the approximate contribution of each variable in the first two dimensions. If the loadings are all close to the origin, they are multiplied by a scalar to make them easier to read. By default, the multiplier is calculated automatically, but you can supply a specific value using this option.
Labels for individuals
Can be used to specify what type of labels to use to identify the individuals on the plot. Select Numbers to display the unit numbers, None for no labels, Unit labels to display the unit labels, or Labels to supply alternative labels using the name of a text structure in the space provided.
Labels for variates
Can be used to specify what type of labels to use to identify the variates on the plot. Select Numbers to display the sequential numbering of the variates, None for no labels, Identifiers to display the identifier names, or Labels to supply alternative labels using the name of a text structure in the space provided.
Grouping factor
For scores from a principal components analysis this specifies a grouping factor that can be used to identify groupings of individuals by plotting the groups using different colours.
Action Icons
| Clear | Clear all fields and list boxes. | |
| Help | Open the Help topic for this dialog. |
See also
- Principal components analysis menu for principal components analysis
- Canonical variates analysis menu for canonical variates analysis
- DBIPLOT and BIPLOT procedures in command mode