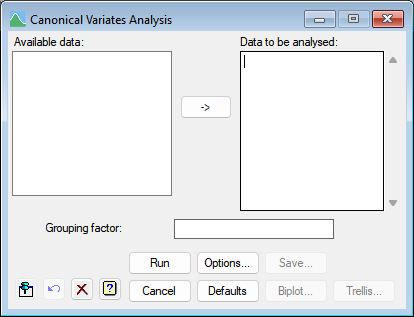
Select menu: Stats | Multivariate Analysis | Canonical Variates
Canonical variates analysis operates on a within-group sums of squares and products matrix, calculated from a set of variates and factor that specifies the grouping of units. It finds linear combinations of the variates that maximize the ratio of between-group to within-group variation, thereby giving functions that can be used to discriminate between the groups.
- After you have imported your data, from the menu select
Stats | Multivariate Analysis | Canonical Variates. - Fill in the fields as required then click Run.
You can set additional Options then after running, you can save the results by clicking Save.

Data values
You can transfer multiple selections from Available data by holding the Ctrl key on your keyboard while selecting items, then click ![]() to move them all across in one action.
to move them all across in one action.
In command mode, the CVA directive lets you specify a within-group SSPM directly as input.
Grouping factor
Used to specify the groups using a factor.
Action buttons
| Run | Run the analysis. |
| Cancel | Close the dialog without further changes. |
| Options | Opens a dialog where additional options and settings can be specified for the analysis. |
| Defaults | Reset options to the default settings. Clicking the right mouse on this button produces a pop-up menu where you can choose to set the options using the currently stored defaults or the Genstat default settings. |
| Save | Opens a dialog to specify names of structures to save the results from the analysis. |
| Biplot | Opens a dialog to produce a biplot of the results from the analysis. |
| Trellis plot | Open the dialog which creates a 2D trellis plot of groups. |
Action Icons
| Pin | Controls whether to keep the dialog open when you click Run. When the pin is down |
|
| Restore | Restore names into edit fields and default settings. | |
| Clear | Clear all fields and list boxes. | |
| Help | Open the Help topic for this dialog. |
See also
- Options for choosing which results to display.
- Saving Results for further analysis.
- Biplot menu to produce a biplot of the results from a principal components analysis.
- Discriminant Analysis menu.
- Stepwise Discriminant Analysis menu.
- K Nearest Neighbours menu.
- Regression Trees menu.
- Random Regression Forest menu.
- Classification Trees menu.
- Random Classification Forest menu.
- CVA directive.
- CVAPLOT procedure
- CVASCORES procedure
- DISCRIMINATE procedure.
- SDISCRIMINATE procedure.