Select menu: Stats | Spatial Analysis| Form Variogram
Use this to form an experimental variogram from a set of values distributed in one or two dimensions. This uses the FVARIOGRAM directive to form the variogram.
- After you have imported your data, from the menu select
Stats | Spatial Analysis | Form Variogram. - Fill in the fields as required then click Run.
You can set additional Options before running and store the results by clicking Store.
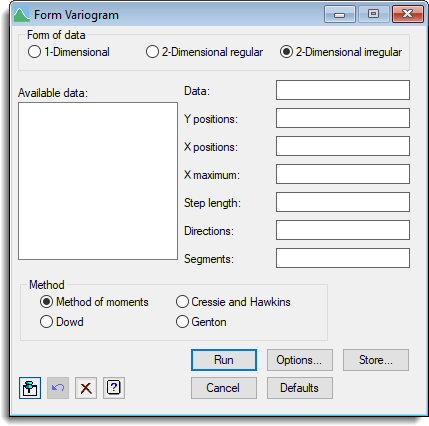
Form of data
Lets you specify the form of the data.
Available data
This lists data structures appropriate to the current input field. The contents of this field will change as you move from one field to the next. You can double-click a name to copy it to the current input field.
Data
Used to enter the data. If the form of the data is one-dimensional, the data should be in a variate. If the form is two-dimensional, and in a regular grid, the data should be supplied in a matrix, otherwise the data should be supplied in a variate.
The remaining fields to be filled in will depend on the form of the data.
1-Dimensional data
| Positions | The intervals or positions |
| Maximum | Maximum lag |
| Step length | Length of each step in which lag is incremented |
2-Dimensional regular data
| Y Maximum | Maximum lag in the y direction |
| X Maximum | Maximum lag in the x direction |
| Step length | Length of each step in which lag is incremented |
2-Dimensional irregular data
| Y positions | Y positions or interval |
| X positions | X positions or interval |
| X maximum | Maximum lag in the x direction |
| Step length | A scalar specifying the length of each step in which lag is incremented or a variate containing each step |
| Directions | Directions (degrees) along which to form the variogram |
| Segments | Angles subtended by the segments (degrees) over which averaging is to be done |
Method
Specifies the method to use when forming the variogram. By default the Method of moments is used for estimating the variogram, however the alternative robust variogram estimators of Cressie and Hawkins, Dowd and Genton can be selected.
Action buttons
| Run | Run the analysis. |
| Cancel | Close the dialog without further changes. |
| Options | Opens a dialog to specify additional options for displaying output and a plot of the variogram. |
| Defaults | Reset options to the default settings. Clicking the right mouse on this button produces a shortcut menu where you can choose to reset options using the currently stored defaults or the Genstat default settings. |
| Store | Opens a dialog to specify names of structures to store the results from the tabulation. You must supply the structure names before running the tabulation. |
Action Icons
| Pin | Controls whether to keep the dialog open when you click Run. When the pin is down |
|
| Restore | Restore names into edit fields and default settings. | |
| Clear | Clear all fields and list boxes. | |
| Help | Open the Help topic for this dialog. |
See also
- Form variogram options
- Form variogram store options
- Model variogram menu
- Krige menu
- FVARIOGRAM directive
- FCOVARIOGRAM directive for forming cross-variograms
- DVARIOGRAM procedure
- MVARIOGRAM procedure
- KRIGE directive