Use this to select options and output to be used for a GGE Biplot.
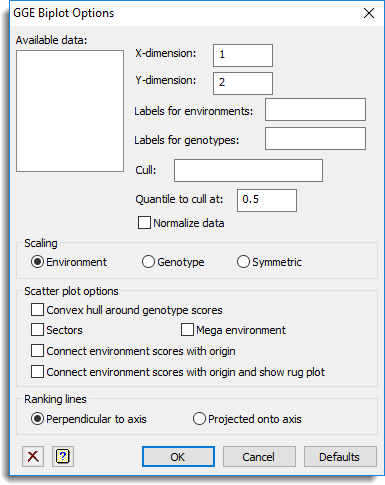
Available data
This lists data structures appropriate to the current input field. It lists text structures for use in specifying the labels for the genotypes and environments (by default they will use their identifiers). Double-click a name to copy it to the current input field or type the name.
X-dimension
Specifies the dimension to show in the x-axis.
Y-dimension
Specifies the dimension to show in the y-axis.
Labels for environments
Specifies a text structure to use for the labels for the environments. If left blank, these are set to be the identifiers of the environments.
Labels for genotypes
Specifies a text structure to use for the labels for the genotypes. If left blank, these are set to be the identifiers of the genotypes.
Cull
Specifies environments where the performance of the genotypes at each of those environments is examined to determine a set of genotypes to cull. When there are a large number of genotypes it may be helpful to cull some of them from the biplot. For example, you may want to remove genotypes that have performed badly in some of the environments. To do this you can supply a scalar(s) or text(s) containing the level(s) or label(s) of the environments that you want to consider. Then, by default, all genotypes with y-values less then the median value at each chosen environment will be removed. Alternatively, you can specify some other quantile at which to cull by setting the quantile to some other value. Note, however, if you select more than one environment when the y-values at the environments are negatively correlated, there may be very few (or possibly no) genotypes left to plot.
Quantile to cull at
If the Cull option is set, then, by default, all genotypes with y-values less then the median value at each chosen environment will be removed. Alternatively, you can supply a value for the quantile for the cull.
Normalize data
Specifies whether the data should be normalized to have unit sums-of-squares before analysis.
Scaling
Controls scaling for environment and/or genotype scores. When either Environment or Genotype options are selected the environment or genotype scores respectively are multiplied by their corresponding eigenvalues. When Symmetric is selected the environments and genotypes are multiplied by the square root of their corresponding eigenvalues.
Scatter plot options
When a scatter plot is selected (a plot of the genotype and environment scores) these options allow further information to be included on the plot.
| Convex hull around genotype scores | Draws an enclosing convex hull around the genotype scores. |
| Sectors | Draws lines from the origin perpendicular to each side of the convex hull around the genotype scores, to divide the biplot into sectors. |
| Mega environment | Draws an ellipse round those environments which share the same sector. |
| Connect environment scores with origin | Draws lines connecting environment scores with the origin. |
| Connect environment scores with origin and show rug plot | Draws lines connecting environment scores with origin together with a rug plot at the side showing the angles between the environments. The first environment must be specified to the label (or level) of an environmental factor which will be used as a “base” factor. |
Ranking lines
Specifies when either a ranking plot or a joint plot is plotted to draw lines perpendicular to the biplot axis or to draw a line from the scores, which is projected onto the axis.
Action Icons
| Clear | Clear all fields and list boxes. | |
| Help | Open the Help topic for this dialog. |
See also
- GGE Biplot menu for plotting GGE biplots
- GGEBIPLOT procedure in command mode