Select menu: Stats | Meta Analysis | GGE Biplot
Use this to plot a GGE biplot for a range of results that are useful for assessing the performance of genotypes in different environments. A principal components analysis on the data variates is undertaken to measure the genotype plus genotype-by-environment variation (the principal components analysis automatically removes the environmental effects from the data). The results obtained are used to calculate environment and genotype scores and these scores are then used to plot various attributes of the genotypes and environments.
- After you have imported your data, from the menu select
Stats | Meta Analysis | GGE Biplot.
OR
After you have imported your QTL data, select
Stats | QTLs (linkage/Association) | Data Exploration | Phenotypic Data | GGE Biplot - Fill in the fields as required then click Run.
You can set additional Options before running by clicking Options.
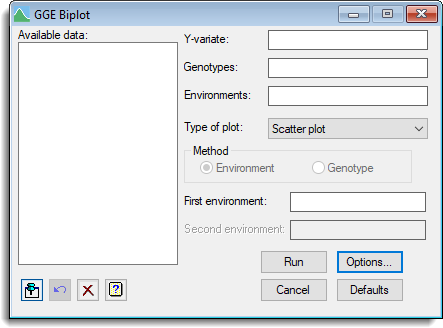
Available data
This lists data structures appropriate to the current input field. It lists variates for use in specifying the response variables, explanatory variables and conditioning variables. Double-click a name to copy it to the current input field or type the name.
Y-variate
Used to enter the names of the variates for the data to be analysed.
Genotypes
A factor specifying the genotypes.
Environments
A factor specifying the environments.
Type of plot
Selects the type of GGE biplot that is to be plotted.
| Scatter plot | Plots the genotype and environment scores. |
| Ranking plot | Shows best performing genotypes (or environments) in specific environment (or genotype). |
| Comparison | Compares the performance of the environments (or genotypes) with that of an “ideal” environment (or genotype). |
| Joint | Compares two environments (or genotypes) simultaneously. |
| Centred scatter plot | Compares the performance of the genotypes (or environments) in two environments (or genotypes). |
Method
Used to specify if the levels or labels in first environment and second environment come from the genotype or environment factor.
First environment and Second environment
For certain plots, first environment and second environment need to be set to the name of an environment or genotype label (or level). For these values the label or level have to be directly typed into the input field. Labels have to entered within single quotation marks, e.g. ‘first’.
Action buttons
| Run | Run the analysis. |
| Cancel | Close the dialog without further changes. |
| Options | Opens a dialog where additional options and settings can be specified. |
| Defaults | Reset back to the default settings. Clicking the right mouse on this button produces a shortcut menu where you can choose to set the options using the currently stored defaults or the Genstat default settings. |
Action Icons
| Pin | Controls whether to keep the dialog open when you click Run. When the pin is down |
|
| Restore | Restore names into edit fields and default settings. | |
| Clear | Clear all fields and list boxes. | |
| Help | Open the Help topic for this dialog. |
See also
- GGE biplot options for optional settings and display
- Biplot menu for plotting biplots
- AMMI menu for fitting additive main effects and multiplicative interaction models
- GGEBIPLOT procedure in command mode