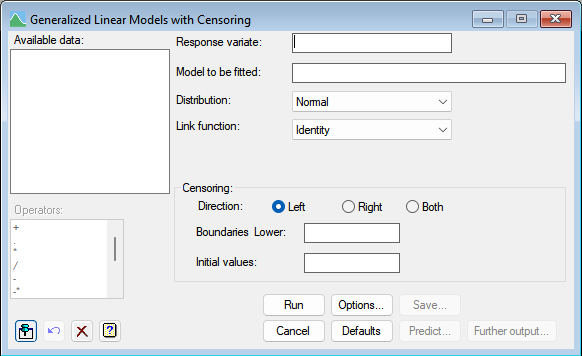
Use this menu to fit a generalized linear model for censored data with a limited range of link functions and error distributions; these are selected using the Distribution and Link function drop down lists. If you choose the Negative Binomial distribution, you must also specify a fixed value for the aggregation parameter (the parameter k in the formula for the variance in terms of the mean: v = m + m*m/k) or else estimate it.
Censored data occurs values are only known to be above or below a specified limit. For example, with left-censored data, some observations may be below the reliable detection limit of a measuring device. Alternatively, with right-censoring, some observations may be so large that it is impracticable to measure them exactly. You can also set direction to both to have censoring in both directions. The values at which the measurements are censored must be specified in the boundary fields. This can be a scalar if all observations are censored at the same value, or a variate if they are censored at different values. If there is both left and right censoring, then both an upper and lower boundary will need to be set.

Response variate
Specifies a variate for the response. This can be entered in directly or can be selected from those within the Available data list.
Model to be fitted
The model to be fitted is specified by entering a model formula into the Model to be fitted field. The formula can involve both variates and factors which can be selected from the Available data list, and operators from the Operators list.
Distribution
List of available error distributions that can allow for censored data. If you select the negative binomial distribution, you must supply the aggregation in the space provided or select the estimate aggregation parameter option.
Link function
Lists the available link functions. Only the Normal and Gamma distributions have a choice of link function. For the Poisson and Negative Binomial distributions, only the Logarithm link is available.
Censoring
These fields provide information about the censoring. The boundaries can either be numbers/scalars for a constant censoring value, or variates if the censoring happened at different values for the units. If censored units have missing values, then these will need to be replaced with a value less than or equal to the lower limit for left censored data, or greater than or equal to the upper limit for right censored data.
Direction
| Left | data is censored on the left with a specified lower limit. |
| Right | data is censored on the right with a specified upper limit. |
| Both | data is censored on the left and right with specified lower and upper limits. |
Boundaries
These fields specify the boundaries beyond which data have been censored. They can be a number, scalar or variate (if the bounds vary for each censored unit).
| Lower | data is censored on the left when it is less than or equal to this value. |
| Upper | data is censored on the right when it is greater or equal is this value. |
Initial values
This field provides a variate with the same length as the Response variate, which is used as the initial values for the expectations of the censored values in the E-M algorithm. This is not required, as the procedures will use the boundaries as starting values if it is not provided. Providing your own initial values may reduce the number of iterations required for convergence.
Operators
This provides a quick way of entering operators in the Model to be fitted formula. Double-click the required symbol to copy it to the current input field. You can also type in operators directly. See model formula for a description of each.
Action buttons
| Run | Run the analysis. |
| Cancel | Close the menu without further changes. |
| Options | Opens a dialog where additional options and settings can be specified. |
| Defaults | Set the menu settings back to the default settings. Clicking the right mouse on this button produces a shortcut menu where you can choose to set the options using the currently stored defaults or the Genstat default settings. |
| Save | Opens a dialog where you can save results from the analysis. |
| Predict | Lets you calculate predictions based on the current regression model. |
| Further output | Lets you display additional results and graphical output from the analysis. |
See also
- Options for optional settings and display
- Further Output for additional output subsequent to analysis
- Saving Results for further analysis
- Fitted Model for graphical display of the model
- Model Checking for diagnostic plots for model checking
- Generalized Linear Models
- Analysis of Variance with Censoring
- Linear Mixed Models with Censoring
- RNTOBIT procedure for the Normal distribution
- RGTOBIT procedure for the Gamma distribution
- RNBTOBIT procedure for the Negative Binomial distribution
- RTOBITPOISSON procedure for the Poisson distribution