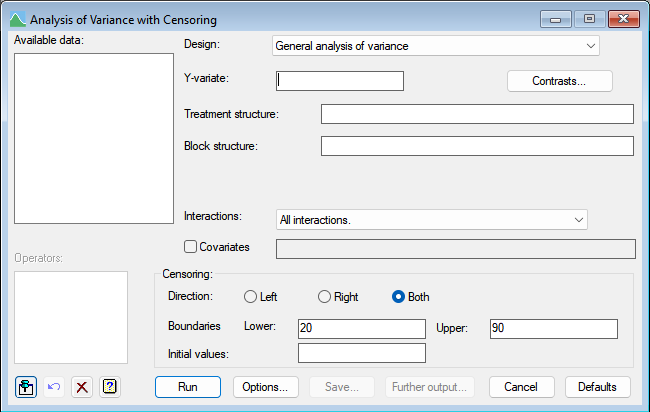
This menu allows you to perform an analysis of variance with censored data using the ATOBIT or AUTOBIT procedures. For example, with left-censored data, some observations may be below the reliable detection limit of a measuring device. Alternatively, with right-censoring, some observations may be so large that it is impracticable to measure them exactly. You can also set direction to both to have censoring in both directions. The values at which the measurements are censored must be specified in the boundary fields. This can be a scalar if all observations are censored at the same value, or a variate if they are censored at different values. If there is both left and right censoring, then both an upper and lower boundary will need to be set.
The menu lets you produce analyses of variance for a wide variety of designs, ranging from simple one-way ANOVA to Latin squares. The General analysis of variance option can be used to fit any generally balanced design not included in the more specific selections. Unbalanced data sets can be analysed using the unbalanced treatment design, or alternatively by using Linear Mixed Model with censoring (which also allows more than one error term). Each of the designs, with the exception of unbalanced treatment structure, can also be generated using the Generate a Standard Design menu.
Design
Selects the type of design to be analysed. See the help specific to each design for a description of its features and the information to be entered.
- General Analysis of Variance
- One-way ANOVA (no Blocking)
- One-way ANOVA (in Randomized Blocks)
- Two-way ANOVA (no Blocking)
- Two-way ANOVA (in Randomized Blocks)
- General Treatment Structure (no Blocking)
- General Treatment Structure (in Randomized Blocks)
- Unbalanced Treatment Structure
- Completely Randomized Design
- Split-Plot Design
- Split-Split-Plot Design
- Strip-Plot (or criss-cross) Design
- Latin Square
- Graeco-Latin Square
- Square Lattice Design (Blocks)
- Lattice Square Design (Rows and Columns)
Available data
This lists data structures appropriate to the current input field. The contents of this field will change as you move from one field to the next. You can double-click a name to copy it to the current input field.
Y-variate
Set this to the variate containing the data values. Available data lists variates available for analysis.
Treatment structure
The treatment structure is specified according to the type of design selected. See the help for the chosen type of design for further details.
Contrasts
This will open a menu that lets you set up contrasts providing comparisons of the effects produced at different levels of a treatment factor.
Block structure
The block structure is specified according to the type of design selected. See the help for the chosen type of design for further details.
Interactions
For designs with more than one treatment factor you can specify whether interactions can be fitted in addition to main effects.
Covariate
Select the Covariate check box if you want to perform analysis of covariance. The adjacent field will become enabled to let you supply a list of the covariates for the analysis. If there is more than one, you can separate their names with spaces or commas. Alternatively, you can specify a model formula to define the terms to be fitted in the covariate analysis.
Censoring
These fields provide information about the censoring. The boundaries can either be numbers/scalars for a constant censoring value, or variates if the censoring happened at different values for the units. If censored units have missing values, then these will need to be replaced with a value less than or equal to the lower limit for left censored data, or greater than or equal to the upper limit for right censored data.
Direction
| Left | data is censored on the left with a specified lower limit. |
| Right | data is censored on the right with a specified upper limit. |
| Both | data is censored on the left and right with specified lower and upper limits. |
Boundaries
These fields specify the boundaries beyond which data have been censored. They can be a number, scalar or variate (if the bounds vary for each censored unit).
| Lower | data is censored on the left when it is less than or equal to this value. |
| Upper | data is censored on the right when it is greater or equal is this value. |
Initial values
This field provides a variate with the same length as the Y-variate, which is used as the initial values for the expectations of the censored values in the E-M algorithm. This is not required, as the procedures will use the boundaries as starting values if it is not provided. Providing your own initial values may reduce the number of iterations required for convergence.
Operators
This provides a quick way of entering operators in the treatment model formula. Double-click the required symbol to copy it to the current input field. You can also type in operators directly. See model formula for a description of each.
Options
This controls display the Options dialog, enabling you to select the output to be generated initially by ANOVA – you can print this same information after the analysis, using Further output.
Save
This open the Save Options dialog that lets you specify data structures in which to save fitted values, residuals and treatment means from the analysis.
Further output
This lets you display additional results from the analysis of variance and produce graphical output of fitted treatment means and diagnostic plots.
See also
- Options dialog for setting the output and options in the analysis.
- Save Options dialog for saving results from the analysis.
- Further Output dialog for additional output subsequent to analysis.
- Multiple Comparisons dialog for specifying multiple comparisons.
- Permutation Test dialog performing random permutation tests.
- Power for ANOVA menu to estimate the power of the analysis of variance.
- ANOVA Equivalence Test dialog.
- ANOVA Equivalence Test Store Options dialog.
- ANOVA % Variance and Sums of Squares dialog.
- Save ANOVA results in a spreadsheet dialog.
- Linear Mixed Model with censoring menu.
- Analysis of variance menu.
- One and two-way analysis of variance menu.
- Parallel ANOVA menu.
- Generalized Linear Models with Censoring
- Linear Mixed Models with Censoring
- Unbalanced analysis of variance, regression and linear Mixed Models for analysing unbalanced data.
- ATOBIT procedure for analysing censored data.
- AUTOBIT procedure for analysing unbalanced censored data.
- TOBIT procedure for a linear mixed model with censored data.
- ANOVA directive balanced treatment structures without censoring.
- AUNBALANCED procedure for unbalanced treatment structures without censoring.